
Mike Simonsen
Mike Simonsen is the founder and president of real estate analytics firm Altos Research, which has provided national and local real estate data to financial institutions, real estate professionals, and investors across the country for more than 15 years. An expert trendspotter, Mike uses Altos data to identify market shifts months before they hit the headlines.
Hey everybody. Happy Thanksgiving week. We were reading the NAR October home sales data this morning which shows strong pricing and demand, but there’s nothing surprising of course if you pay attention to Altos Research and these videos each week. I’ll share some insights and how to read the NAR data as we look at where the market is at the end of November 2021.
Each week Altos Research tracks every home for sale in the country, all the pricing, supply and demand, and all the changes in that data and we make it available to you before you see it in the traditional channels, like NAR for example.
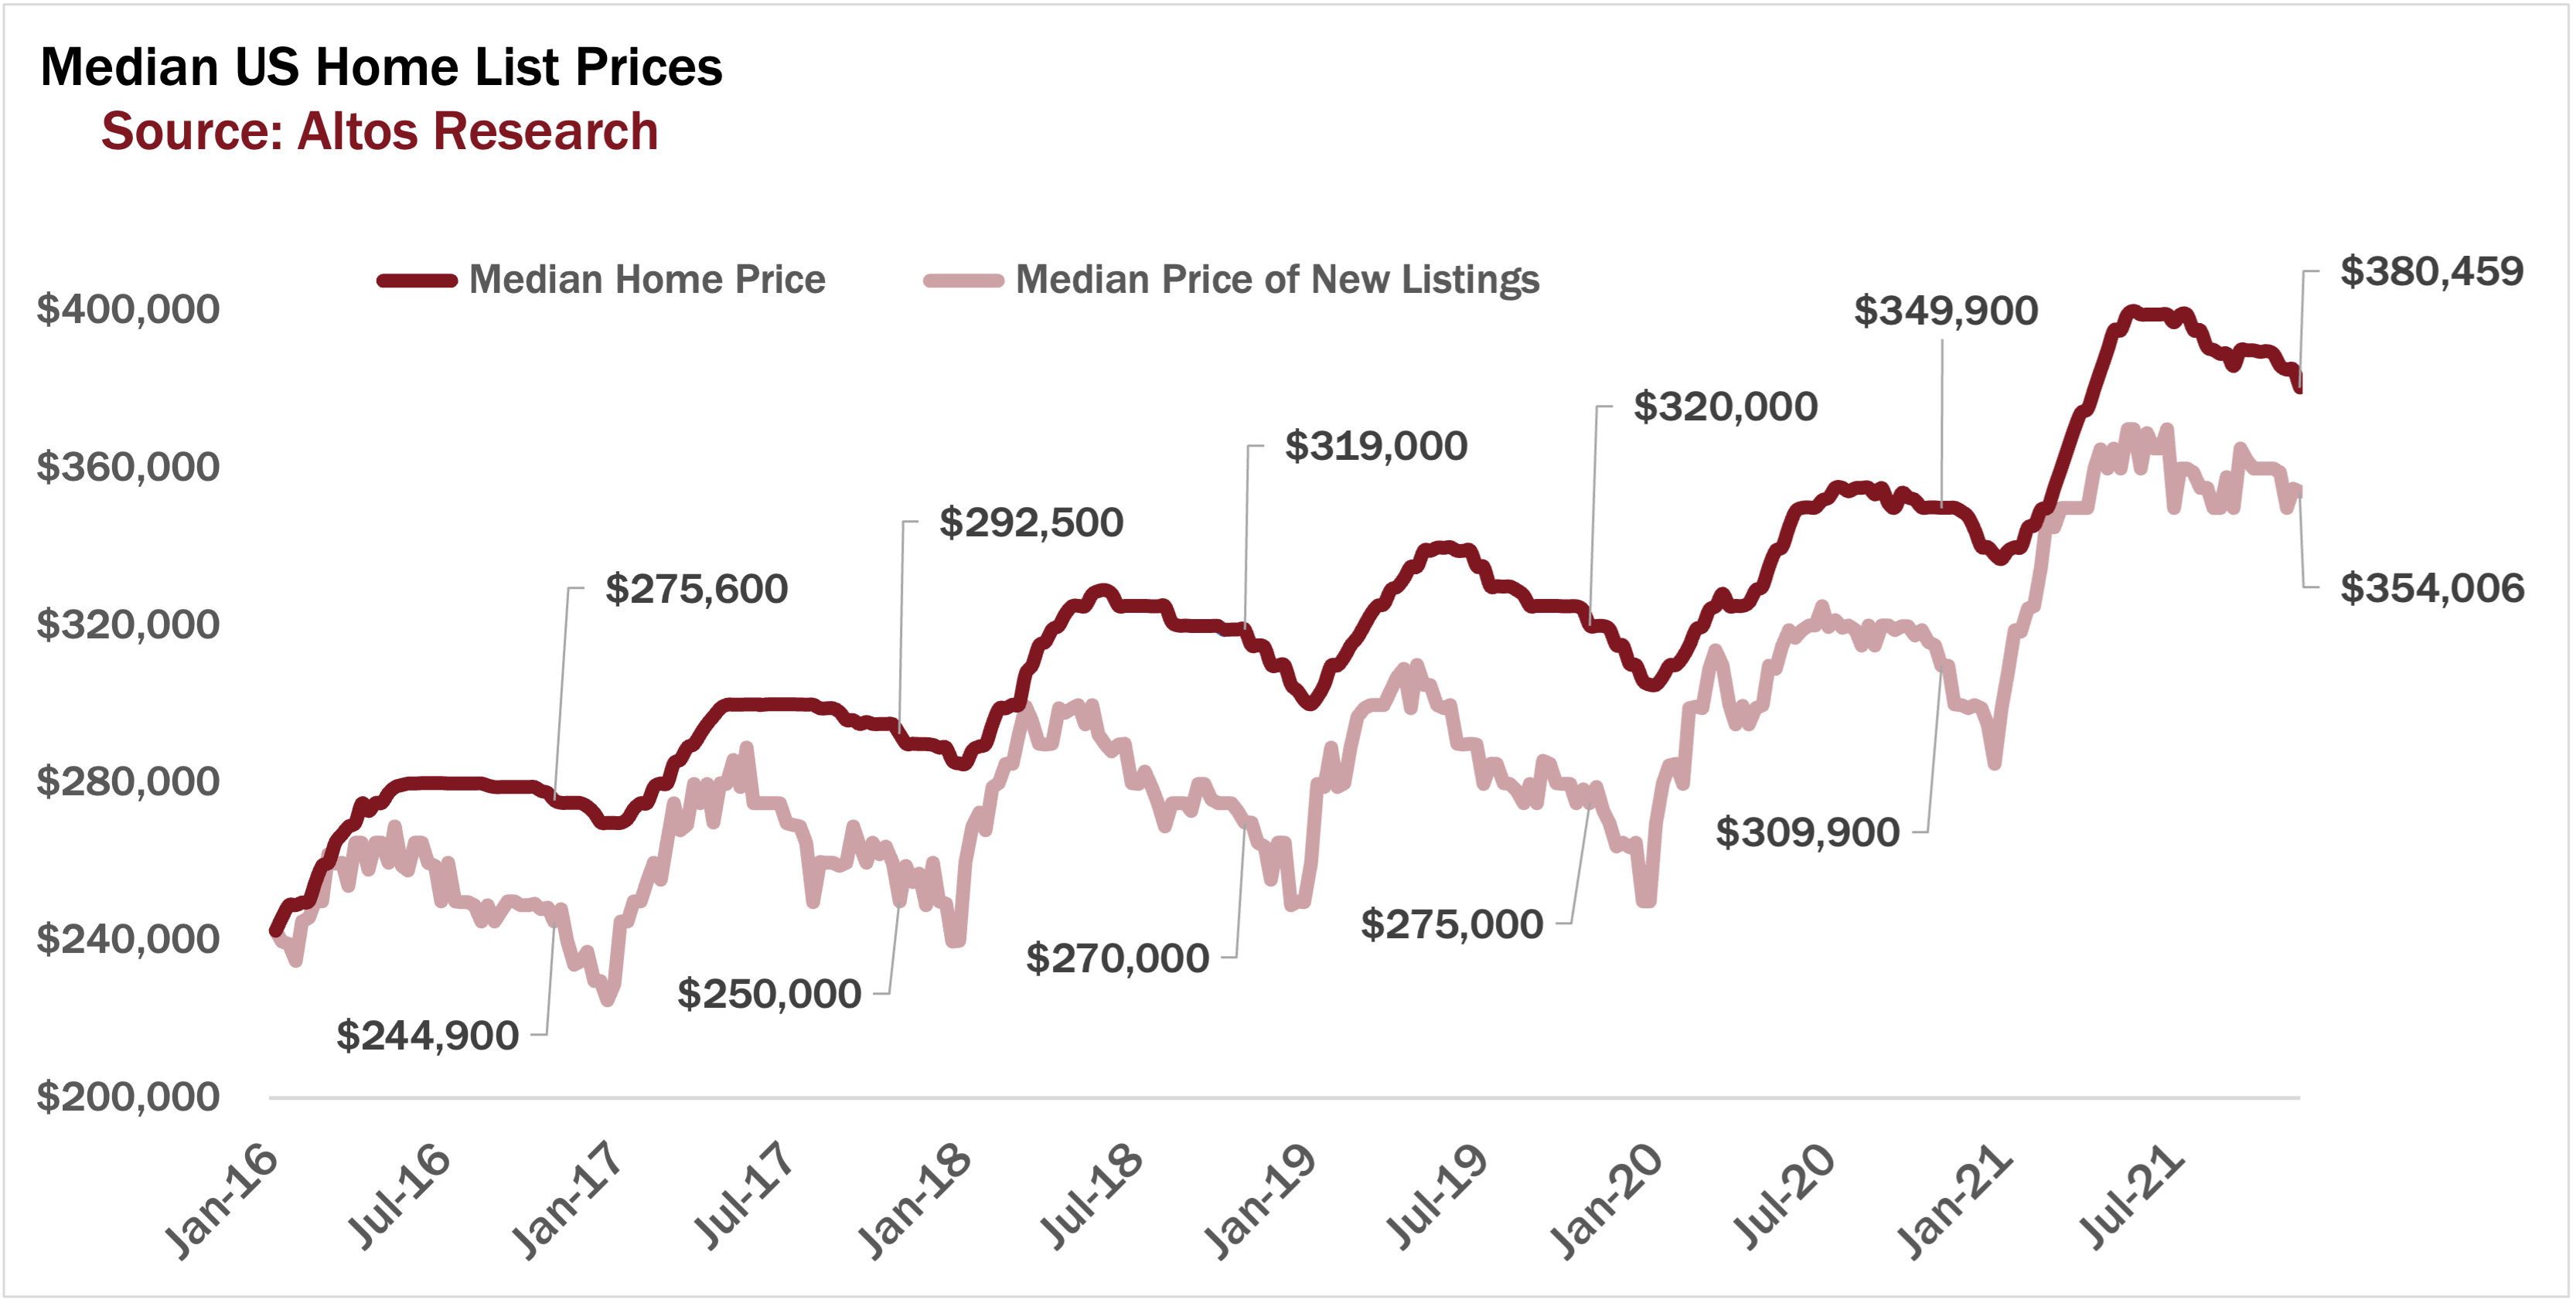
Median home price in the US this week is $380,459. That’s down a fraction from last week. And up just under 10% from a year ago.
Last year the market kept powering straight through the holidays, so the year over year comparisons are very tricky right now. The median price of the newly listed cohort–that’s the lighter colored line here–is $354,000 down just a smidge from last week.
Remember that the Price of New Listings is the leading indicator for the whole market and it’s stayed elevated into the fall so far. I do expect the next 5 weeks to see that tick down each week though. If you list your house during Thanksgiving week, you more often give it a little discount tohelp it move. The light colored line should dip from here to end the year. You can see the annual low points repeating.
As I mentioned, the national association of realtors today released their October sales numbers and there were a couple things to note: NAR today reported that October home sales prices were up 13% year over year. The NAR readings are more up to date than for example the Case Shiller, whose most recent release reported August at like 17% year over year gains.
But of course, if you’ve been paying attention to Altos Research data, you’ll note that we’re now showing year over year price growth slowing from that peak of the frenzy. In May, we reported the 18% year over year gains, by late summer we were showing 13% and right now it’s about 10% year over year home price gains.
Home prices are up about 10% over last year at this time in our analysis. Because the actual sale lags a month or more or so behind the active market, The home is on the market now, it gets an offer in December and closes the sale in January. The NAR data will report in February what we’re seeing now.
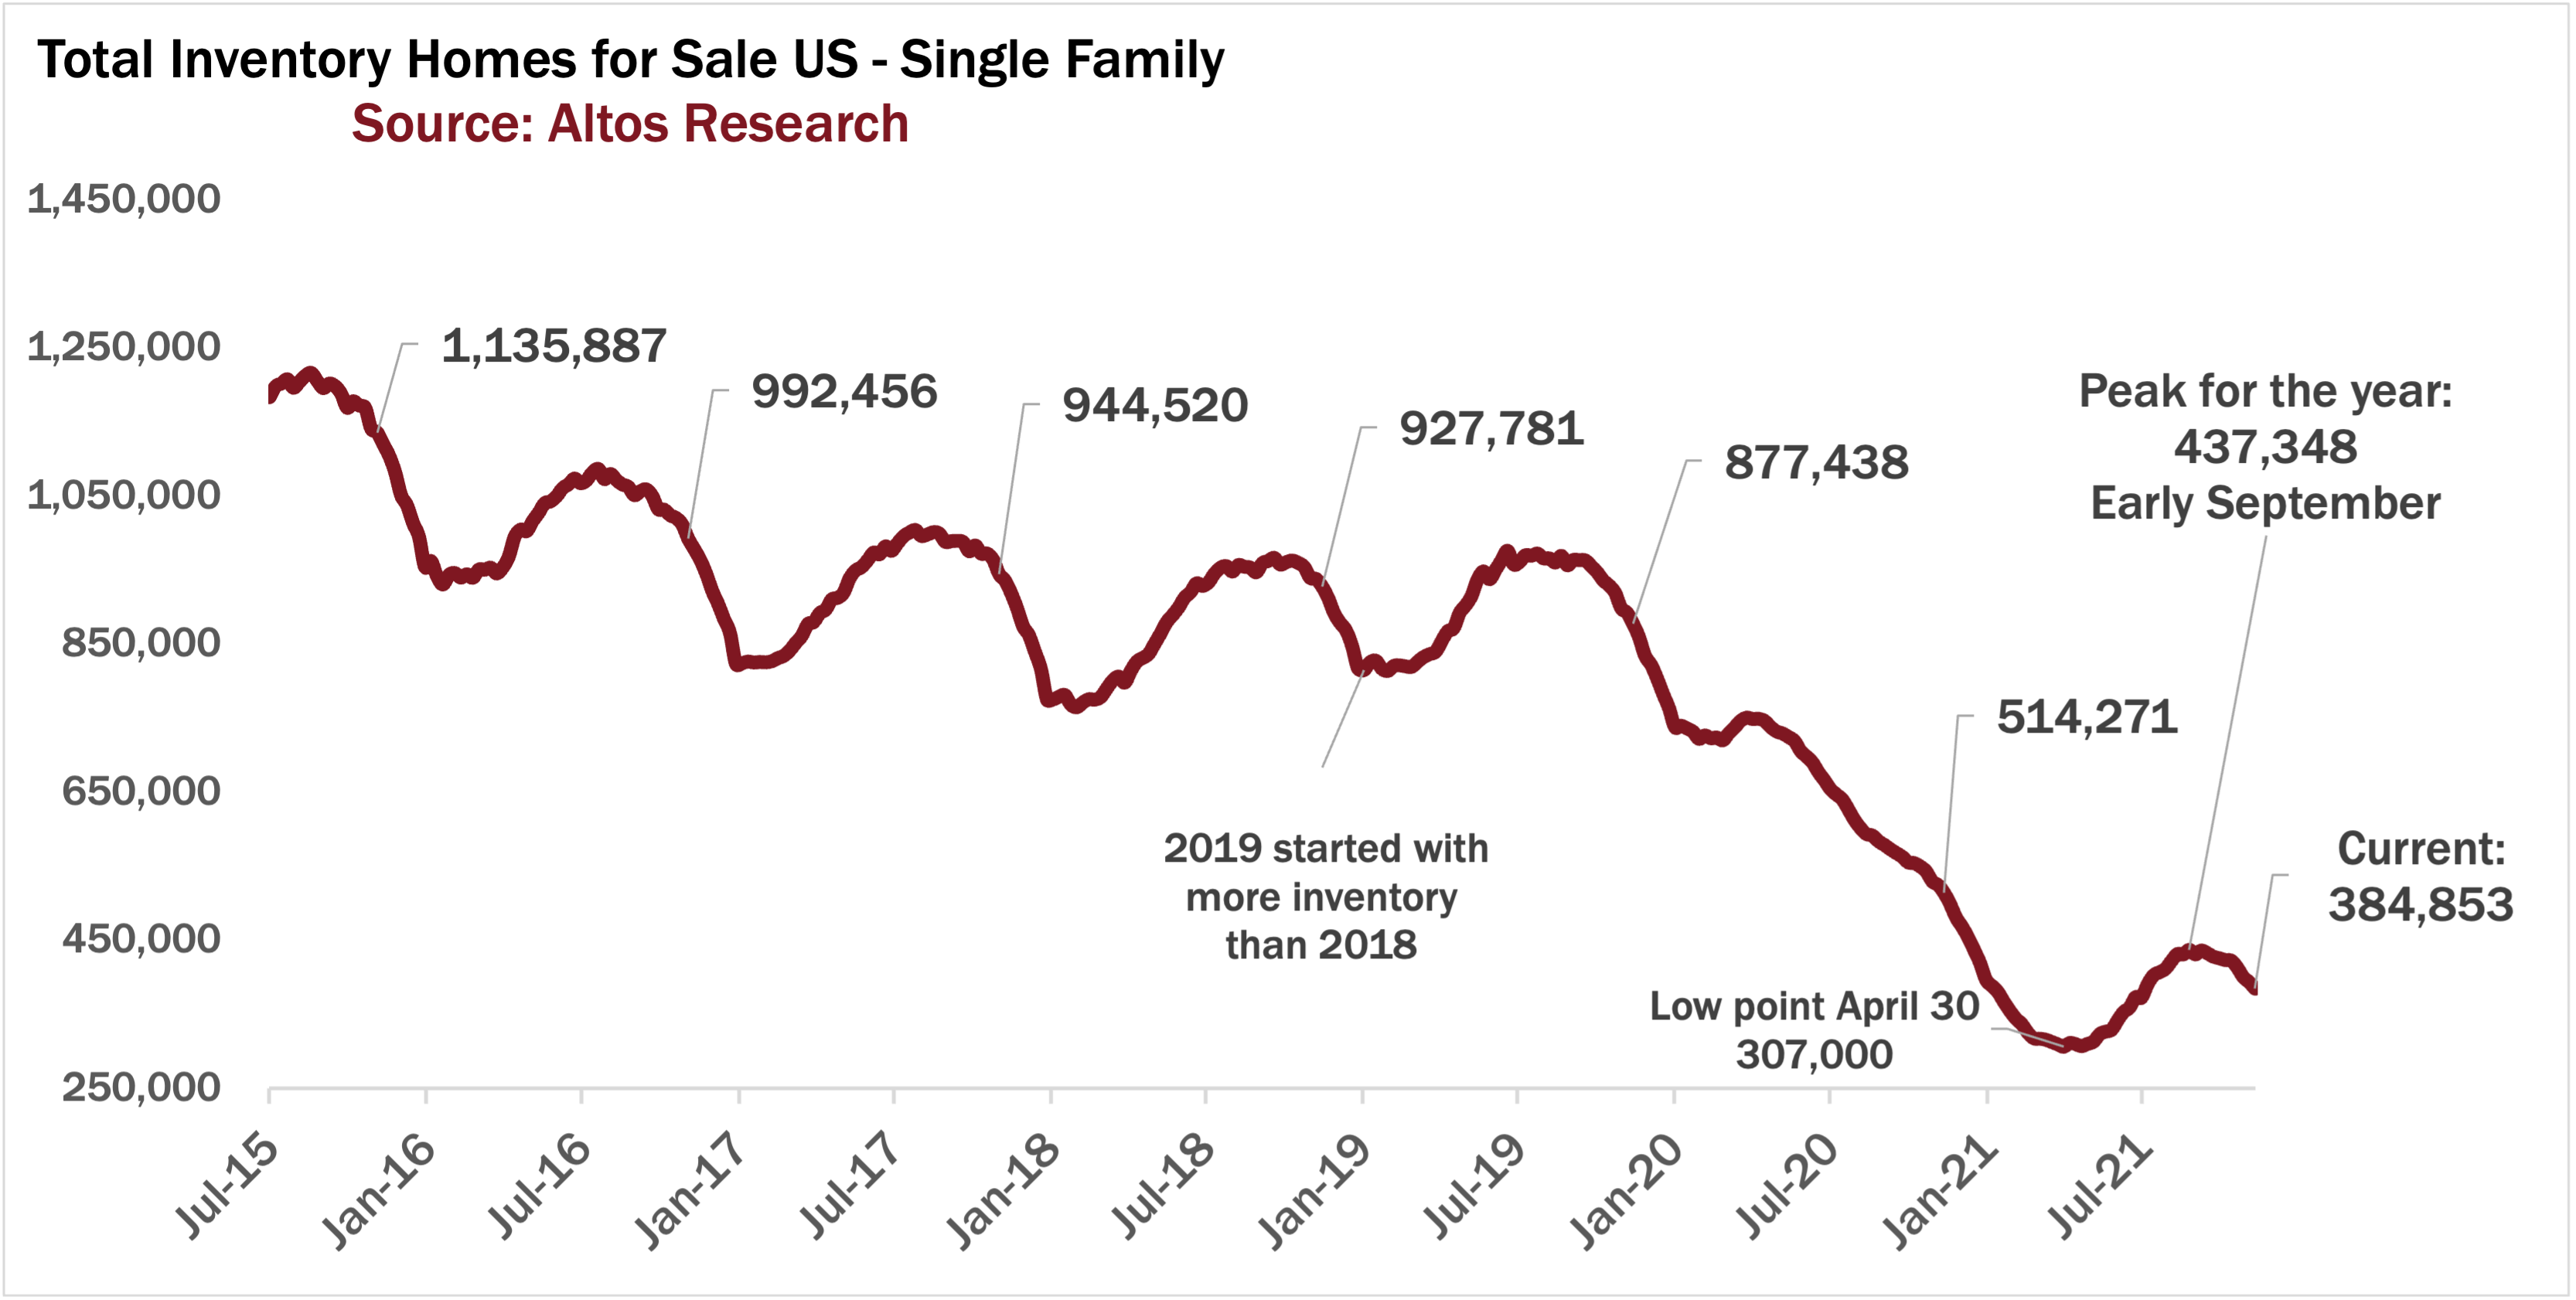
The thing to learn here is that if you’re interested in the monthly NAR readings, you look at the Altos data a few months ago for the predictive power. Active inventory of available unsold single family homes dropped by over 2% this week to 385,000. That decline is totally normal for this time of year.
Last year we were at 514,000 which was totally new territory at the time. The pattern of seasonal inventory trends seems like it is back to a normal shape, just shifted lower by half a million homes. Because of that more normal curve, we continue to forecast that we’ll end the year just under 300,000 homes.
What’s unclear at this point is how 2022 starts. Is it a normal season where inventory starts to build in February and March? Or are we in a new pattern established by last year where inventory keeps dropping through April? I suspect it’s the former, a more normal pattern, only because it’s so hard to imagine the market functioning properly if supply gets even further restricted.
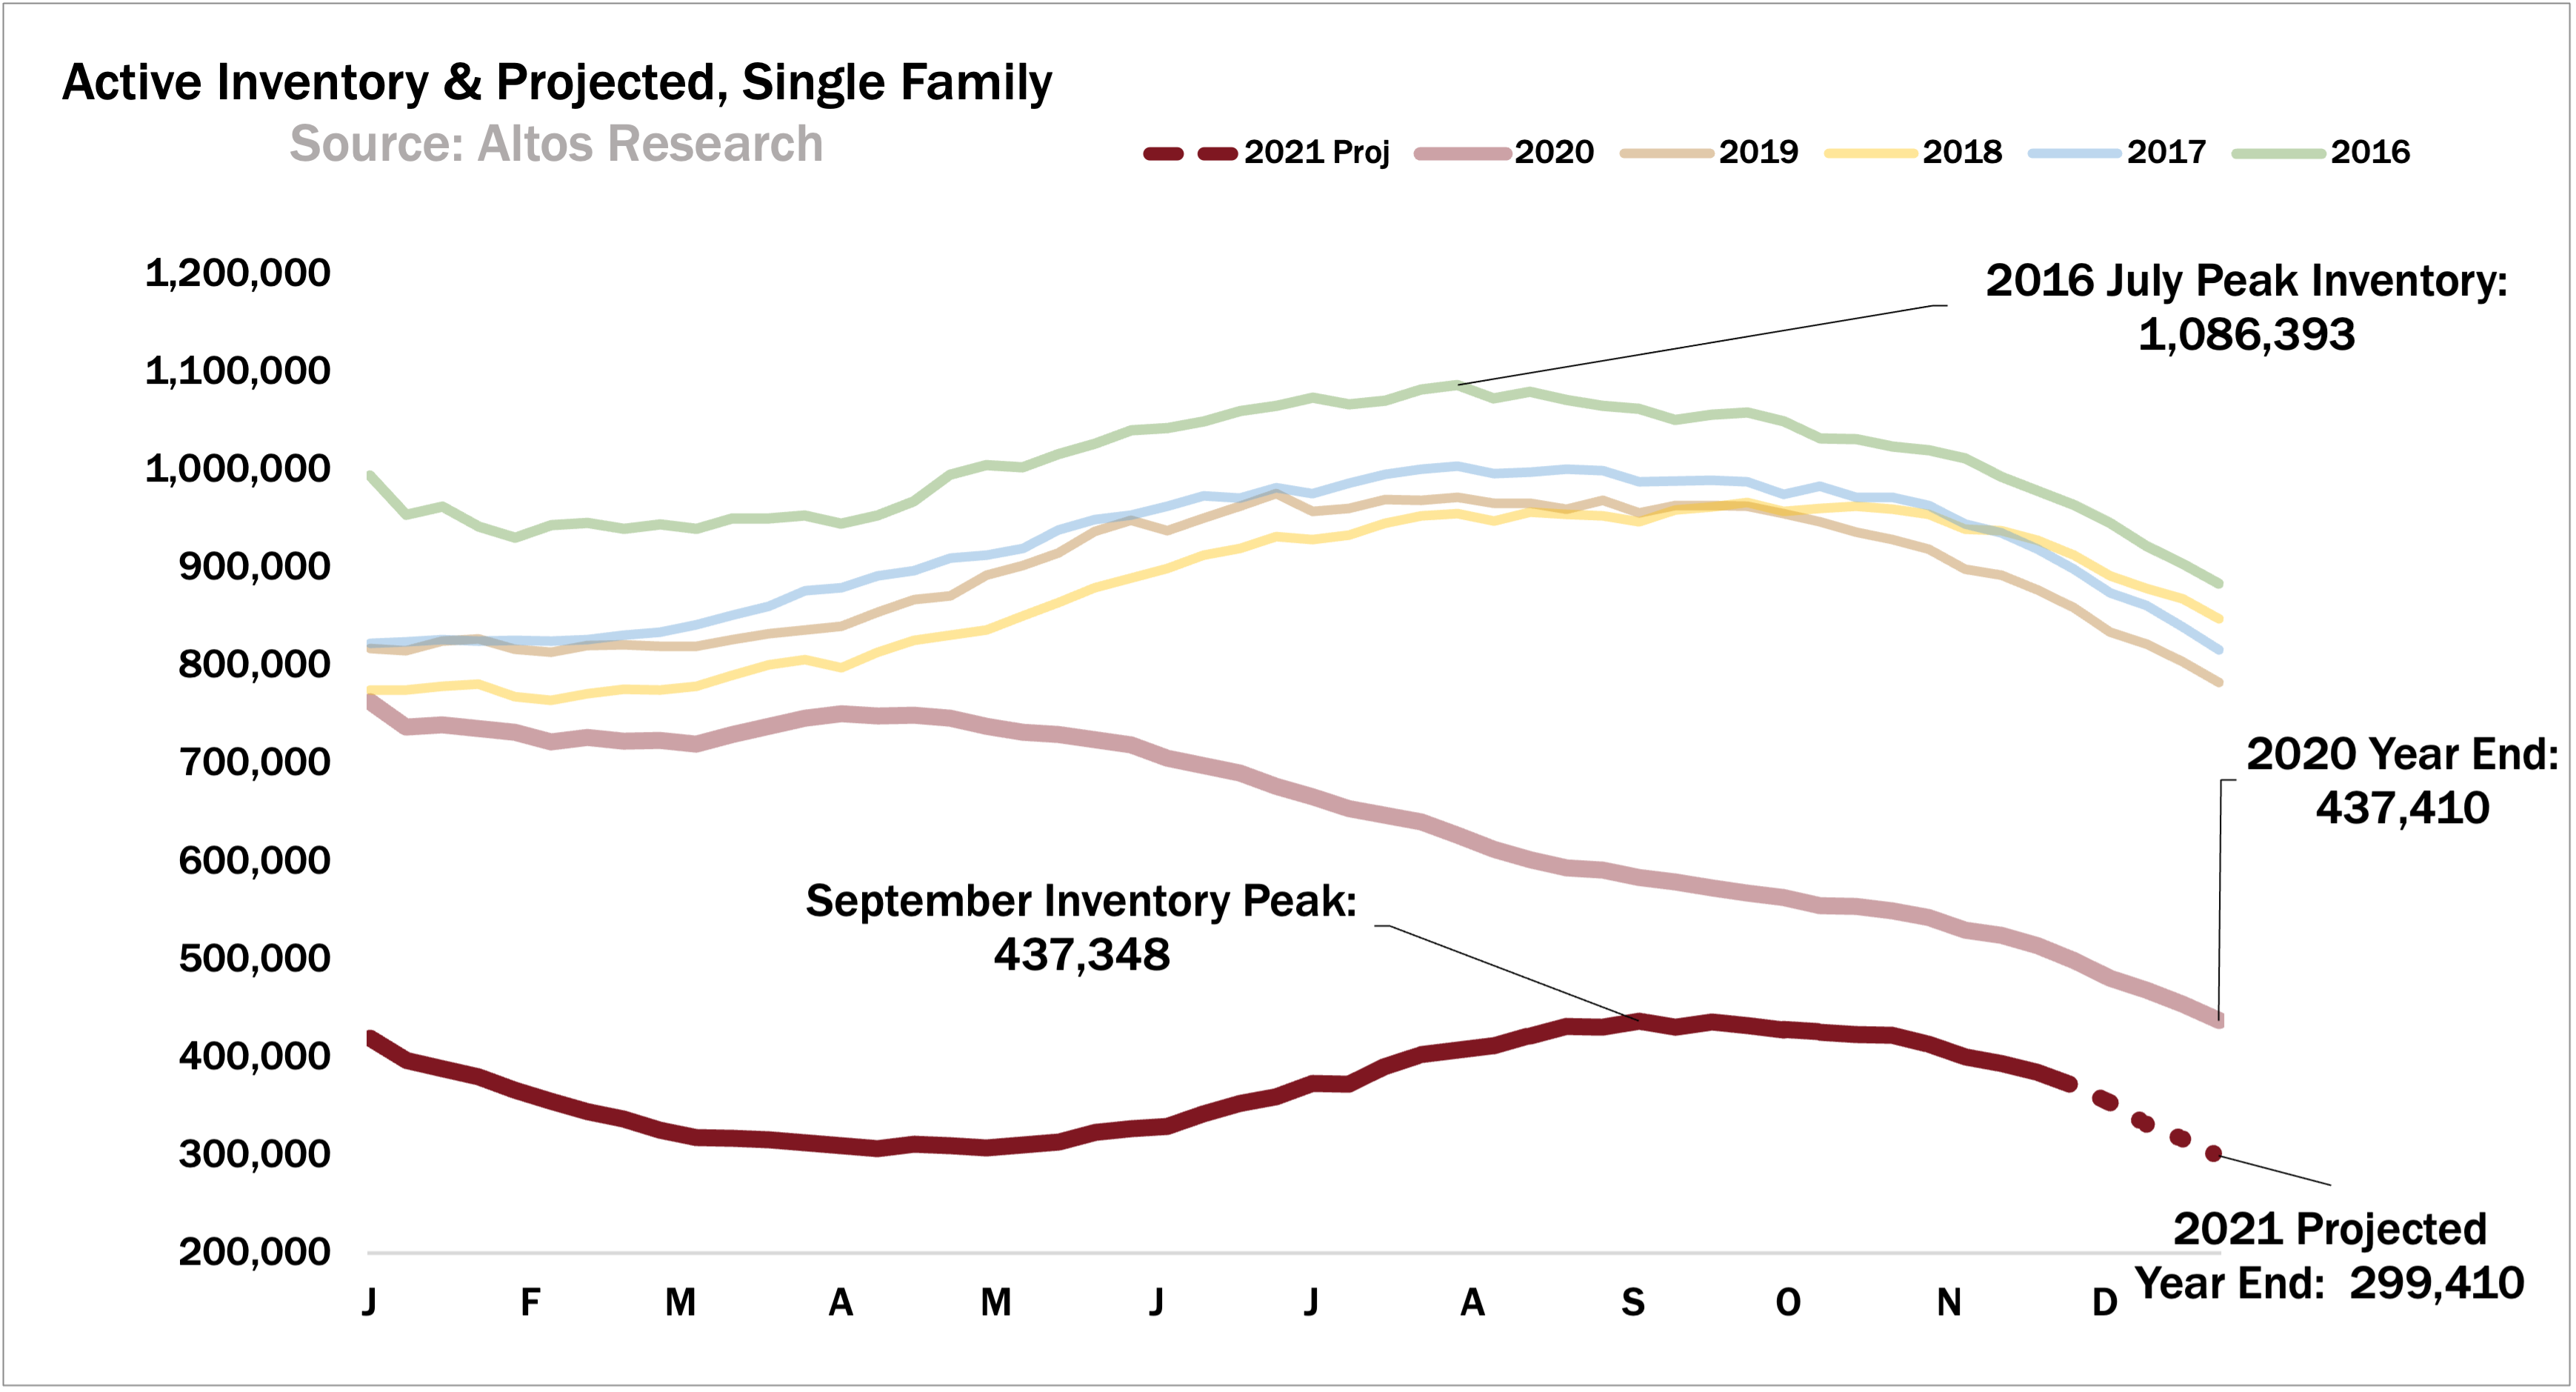
It sure seems like a repeat of last spring, with that demand we had, would pull more supply available. But I don’t have any way to forecast more precisely yet. So that’s just an assumption.
When we look at our immediate sales tracker, we’ve flipped this analysis this week. Previously we’ve been sharing immediate sales as a percentage of the new listings. Of all the new listings, this 25% sold essentially immediately. This week we’ve flipped the chart to show of all those that went into contract this week, what percent were immediate sales a percentage of the new contracts rather than a percentage of the new listings.
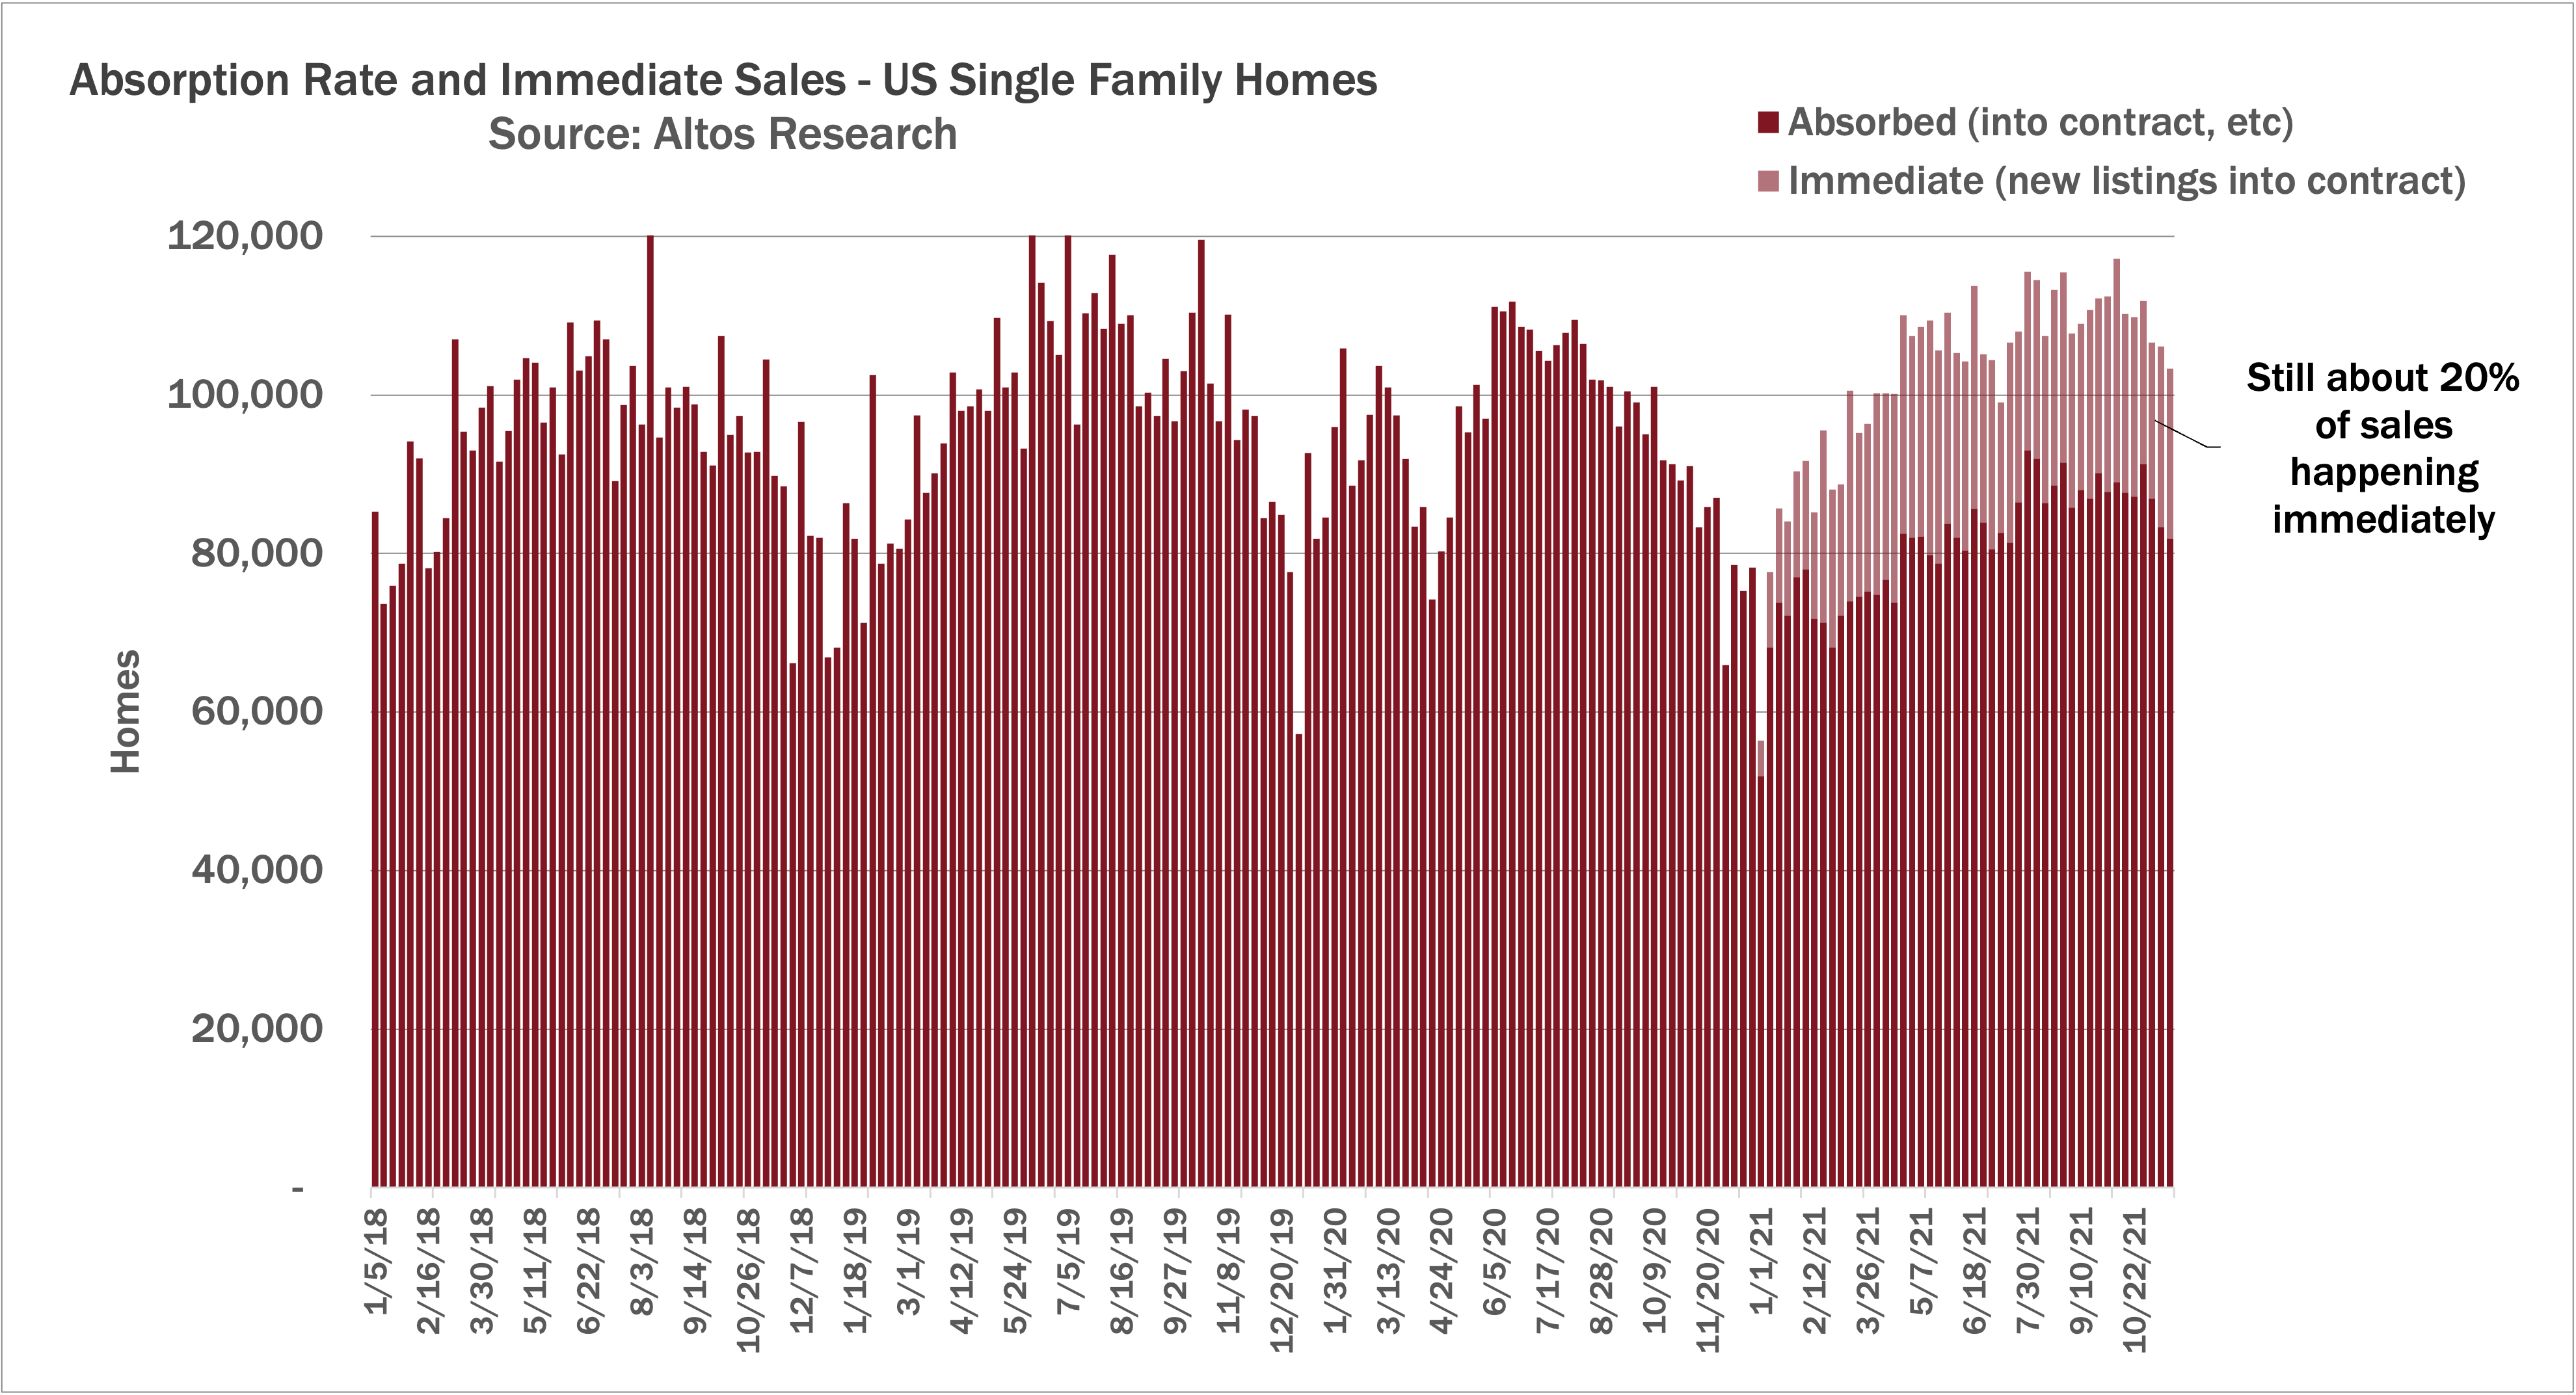
The light colored lines here are the immediate sales. Those that got listed and went into contract within hours or just a few days. Immediate sales have always happened a little bit, but this year because they became such a notable phenomenon, we started tracking them explicitly.
The thing to notice here is how the total sales volume, both lines together, has stayed unseasonably high late in the year. If we’d tracked immediate sale last year you could see the same thing in the second half of 2020. It’s one way of illustrating the unrelenting consumer demand.
As of right now a little over 20% of the properties going into contract are these immediate transactions. By the way, we call this “absorbed” because these properties are not yet sold. Contracts fall through, properties get relisted. This absorbed measure is the earliest proxy for sales that will happen in the future.
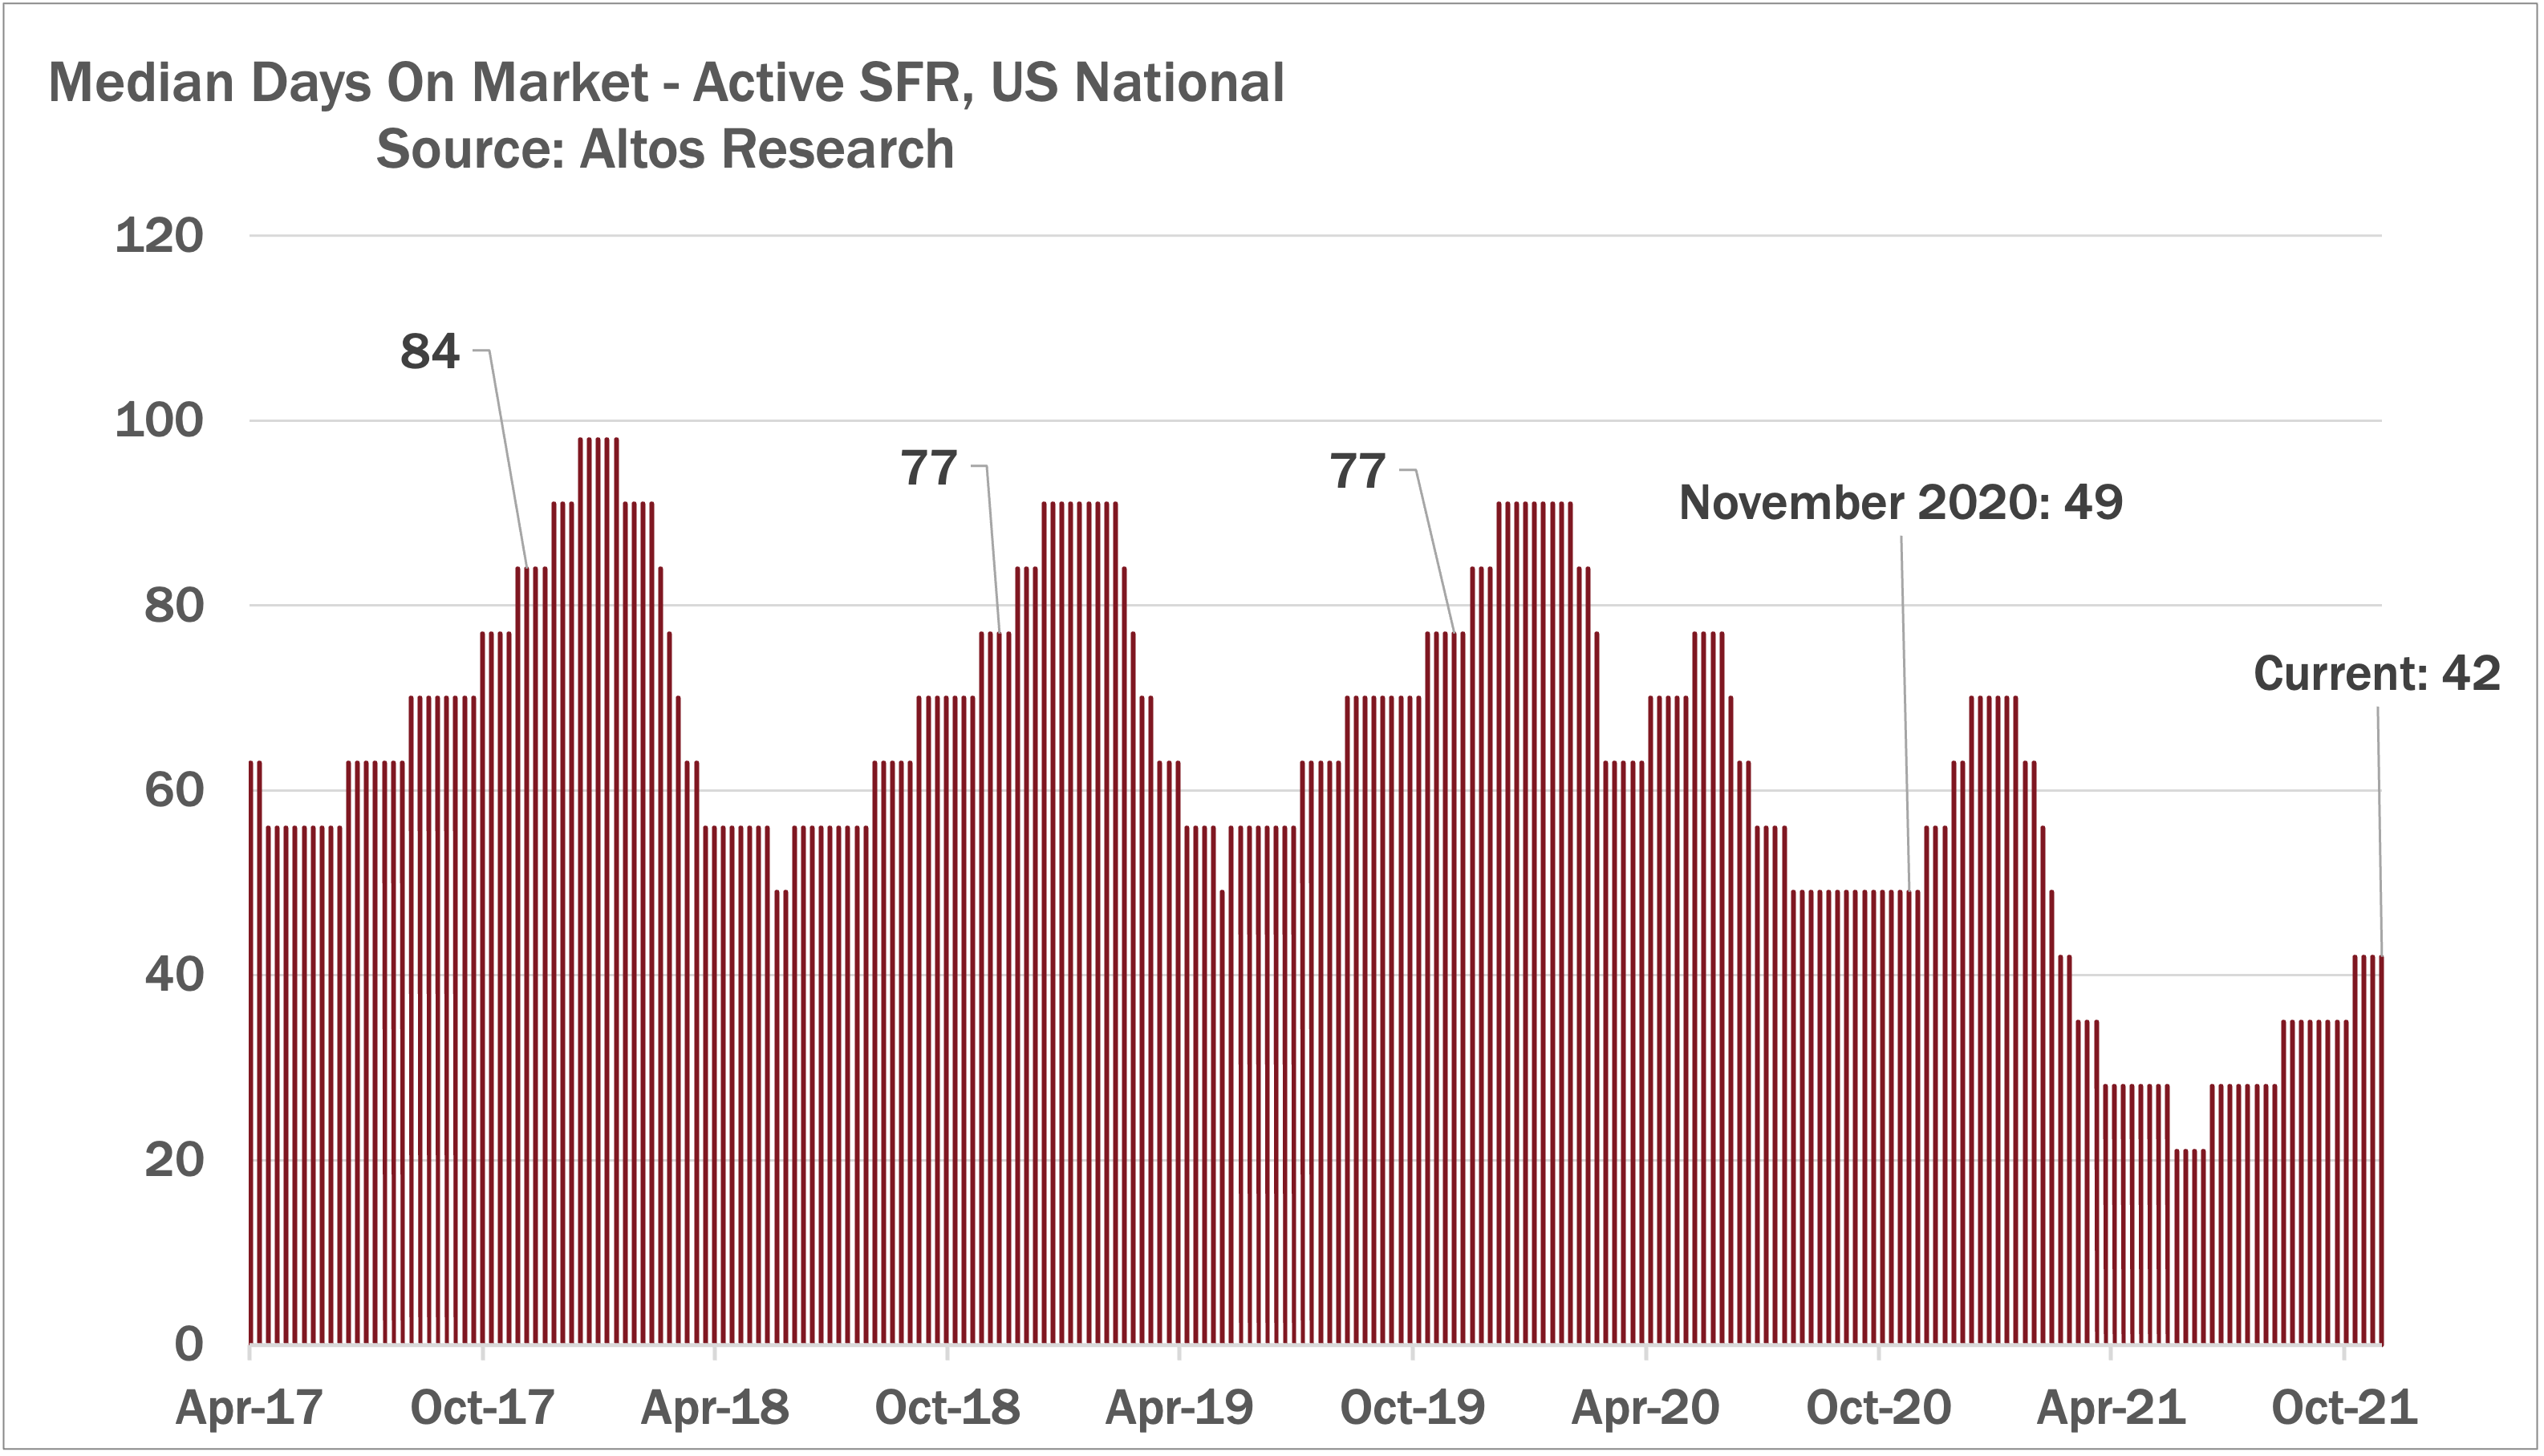
Keeping our eye on market time, we can see that days on market isn’t really climbing yet. The pattern is normal for this time of year, just the speed is different. Days on Market will continue climbing for the next 10-12 weeks.
The time on market peaks in February because you have stuff that sat on the market over the holidays and hasn’t moved yet. This pattern is another one that’s going to be fascinating to watch in the spring. How quickly does it fall and how low does it go in peak buying season next spring?
It’s hard to imagine a scenario where market time suddenly surges back to the old normal levels next year. A more gradual adjustment over a couple years seems more likely.
Bottom line is that all the data right now is pointing to tight supply and strong demand well into the new year.
Tthat’s all the time we have for today. Home buyer demand is remaining plenty robust as we approach the holidays as a result home prices are not slowing at all. if you’re a realtor, and you’re working with buyers and sellers right now, or you want to help them to take action in the new year, they need you to get them the data. To do that, I recommend you go to AltosResearch.com and book time with our team. Have a wonderful holiday everyone. I’m grateful for your attention. Back next week.