Mike Simonsen
Mike Simonsen is the founder and president of real estate analytics firm Altos Research, which has provided national and local real estate data to financial institutions, real estate professionals, and investors across the country for more than 15 years. An expert trendspotter, Mike uses Altos data to identify market shifts months before they hit the headlines.
I have a good friend whose tourism business has been devastated by the pandemic. His company went from many millions of dollars in revenue to almost zero in a matter of weeks in February, before even the lockdown rules went into place. My friend is a brave fighter and a remarkable entrepreneur but he was just unfortunate to be in the industry most impacted by the year's crisis.
He is not alone. We have a real economic crisis due the the pandemic. Millions of Americans are unemployed and 3.4 million are still in the mortgage forebearance program not paying their monthly payments. But the real estate market is as hot as it has ever been. How can that be?! It turns out that American homeowners are in a stronger position than they have ever been. In fact 600,000 of those who started the forebearance program have already resolved their way out of it. Unless mortgagee rates spike or other calamity strikes, this trend is likely to continue into the spring.
This week's video shares the story.
For more details, read on:
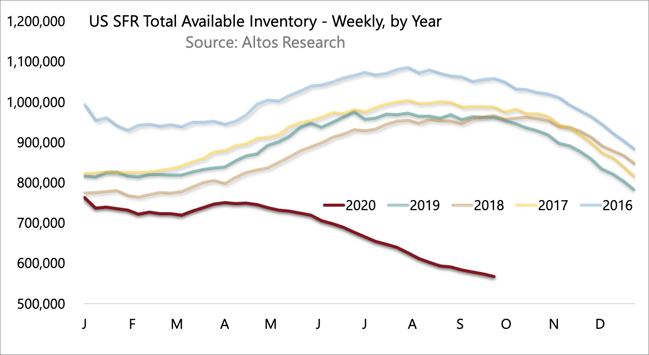
We started 2020 with an intense shortage of inventory and it turned more intense every week since early April. US Active Inventory of single family homes for sale is down to 568,000(!) as of Friday September 25, 2020. That's down another 1% this week. Here's a chart of the weekly inventory numbers for single family homes in the US, with a comparison over the last 5 years.

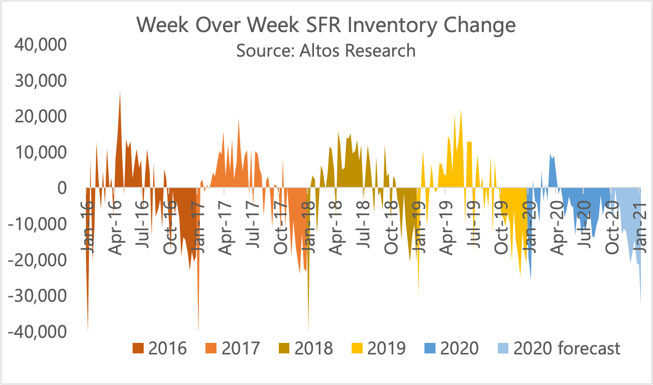
Our forecast of weekly inventory changes through the end of the year implies that we'll likely be at only 381,000 homes on the market by the second week of January. Starting the third week of October, the market pulls way back each week for the two holiday months. in the following chart you can see how in the second- and third quarters of 2020 Americans just sucked up every home in sight. You can also see our forecast changes through the start of the year.

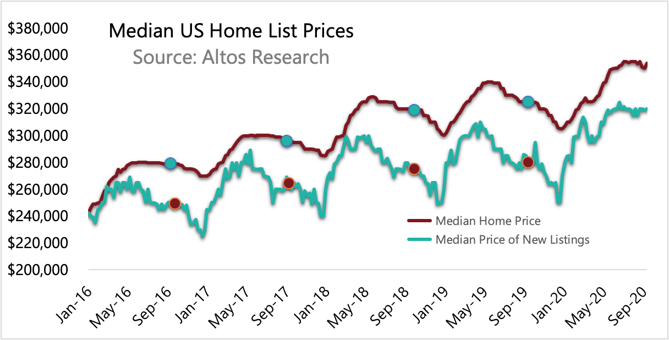
As a result of record high demand and record low supply, home prices are maintaining record high levels into the fall. This means Americans record levels of equity keeps growing too. Many billions of dollars in wealth has been added to homeowners pockets over the last 6 months. In our weekly chart of home prices, below, we look at the entire active market for the country and the pricing of the cohort of newly listed properties. American homeowners are in the strongest position ever.

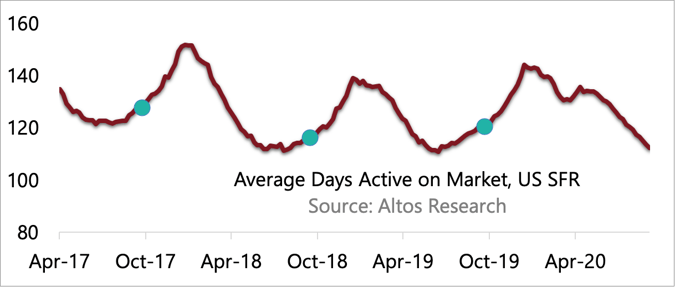
You can see the demand in measurements like the time it takes to sell homes. Normally the autumn sees DOM increasing as fewer deals means homes linger on the market longer. We usually have a gentle, seasonal increase in DOM until the second week of January when the new stock starts to hit the market for the spring selling season. Not this year. This market still behaving like it's June.

As a result, record equity and quick sales times mean that even those who remain unemployed into next year should be able to sell quickly and capture their cash instead of falling into foreclosure. In fact, back in 2008-2010, at Altos we showed how the average time on market was more predictive of mortgage default rates than was a borrower's credit score. You're most likely to default on your mortgage if you think you're never going to be able to sell anyway.
As part of his personal strategic plan to recover, my friend sold his California home. He and his family chose to downsize, and they were able to convert a sizable chunk of wealth from equity to cash in a matter of days. My friend s now preparing himself and his company for recovery once the tourism industry begins to move again. He was lucky to have his home and his equity, he was smart to take advantage of it. He is not, however, alone.
