
Mike Simonsen
Mike Simonsen is the founder and president of real estate analytics firm Altos Research, which has provided national and local real estate data to financial institutions, real estate professionals, and investors across the country for more than 15 years. An expert trendspotter, Mike uses Altos data to identify market shifts months before they hit the headlines.
Even as inventory climbs each week, home prices are still very strong. The next few months of transition are going to be fascinating. Very hard actually to communicate.
If the market is obviously slowing, how can we still be hitting record high prices every week? One interpretation of these trends is that we’re seeing the start of a negative cycle where sellers get scared and dump their homes.
If you’re the type who is bearish on the American consumer, who sees the American economy as a house of cards ready to crumble, these early signs are probably exciting for you. Confirmation for a crisis that you’ve been seeing brewing for a long time.
I frankly see a much more moderate path over the next year. We try to point out here the market signals as soon as they arise. The signs we see are clearly that the pandemic home buying frenzy has passed. Buyers will continue to have more options and less competition. Fewer bidding wars. Less often bidding over the list price. But it’s hard to see home prices falling in the next year. Home price appreciation will likely flatten, so if you bought in March of this year, you probably won’t have any significant equity gain by next spring, but nothing more scary than that.
Every week Altos Research tracks every home for sale in the country. We analyze all the pricing, supply and demand, and all the changes in that data and we make it available to you before you see it in the traditional channels.
If you aren’t using Altos market reports with your clients,, now might be the time to step up. Go to AltosResearch.com and book a free consult with our team. Because everyone is worried about what’s happening right now. I’m Mike Simonsen, I’m the CEO of Altos Research. Here’s what we’re looking at for the week of May 30 2022.
Real Estate Inventory
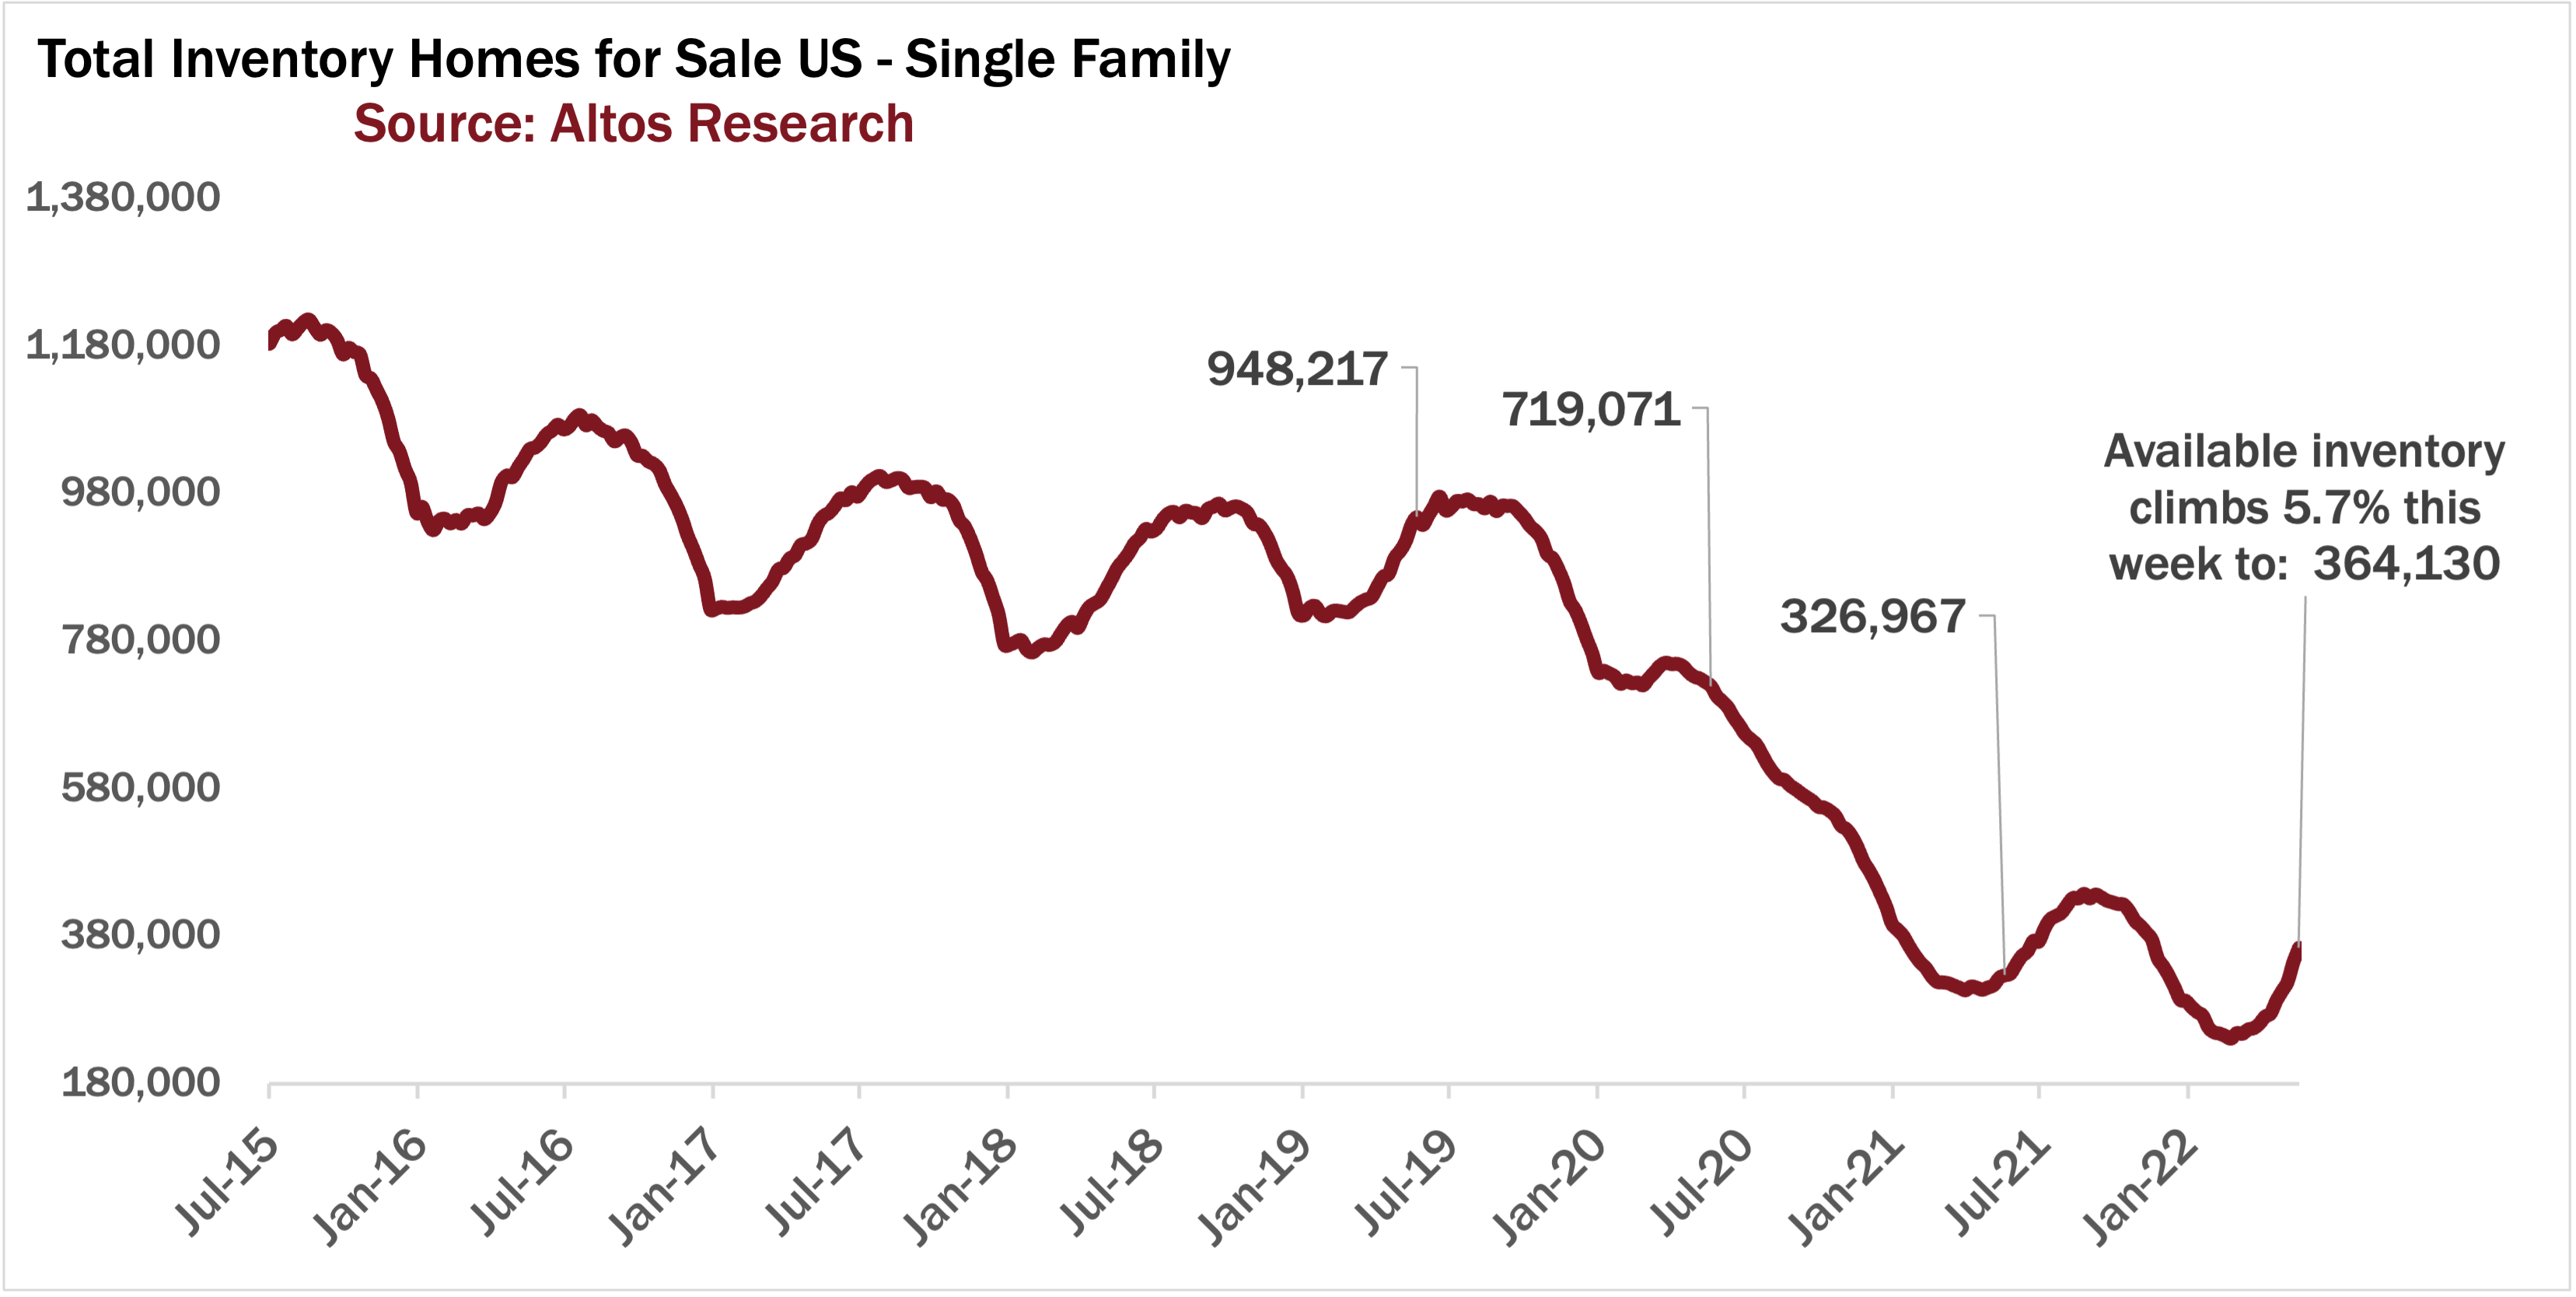
Available inventory grew quickly again this week to 364,000 single family homes on the market. That’s up 5.7% form last week. 19,000 more homes unsold on the market. That’s a little more than the model predicted for the week. If you remember last week we had a bigger growth of 26,000. Next week will include the holiday week so next Monday’s data should have slightly smaller growth again. Maybe inventory hits 370,000 next week. So this is good: more inventory, but not a scary amount. Inventory growth is not accelerating or going parabolic or anything. And why would it. There’s no catalyst for a big wave of new inventory. There are no distressed sellers, we have record few people in any stage of mortgage delinquency and we have very strong employment. What we have is slightly moderating demand, slightly fewer investors, and a bit more sellers. Each week makes is a bit easier for the buyers who’ve been struggling for two years.
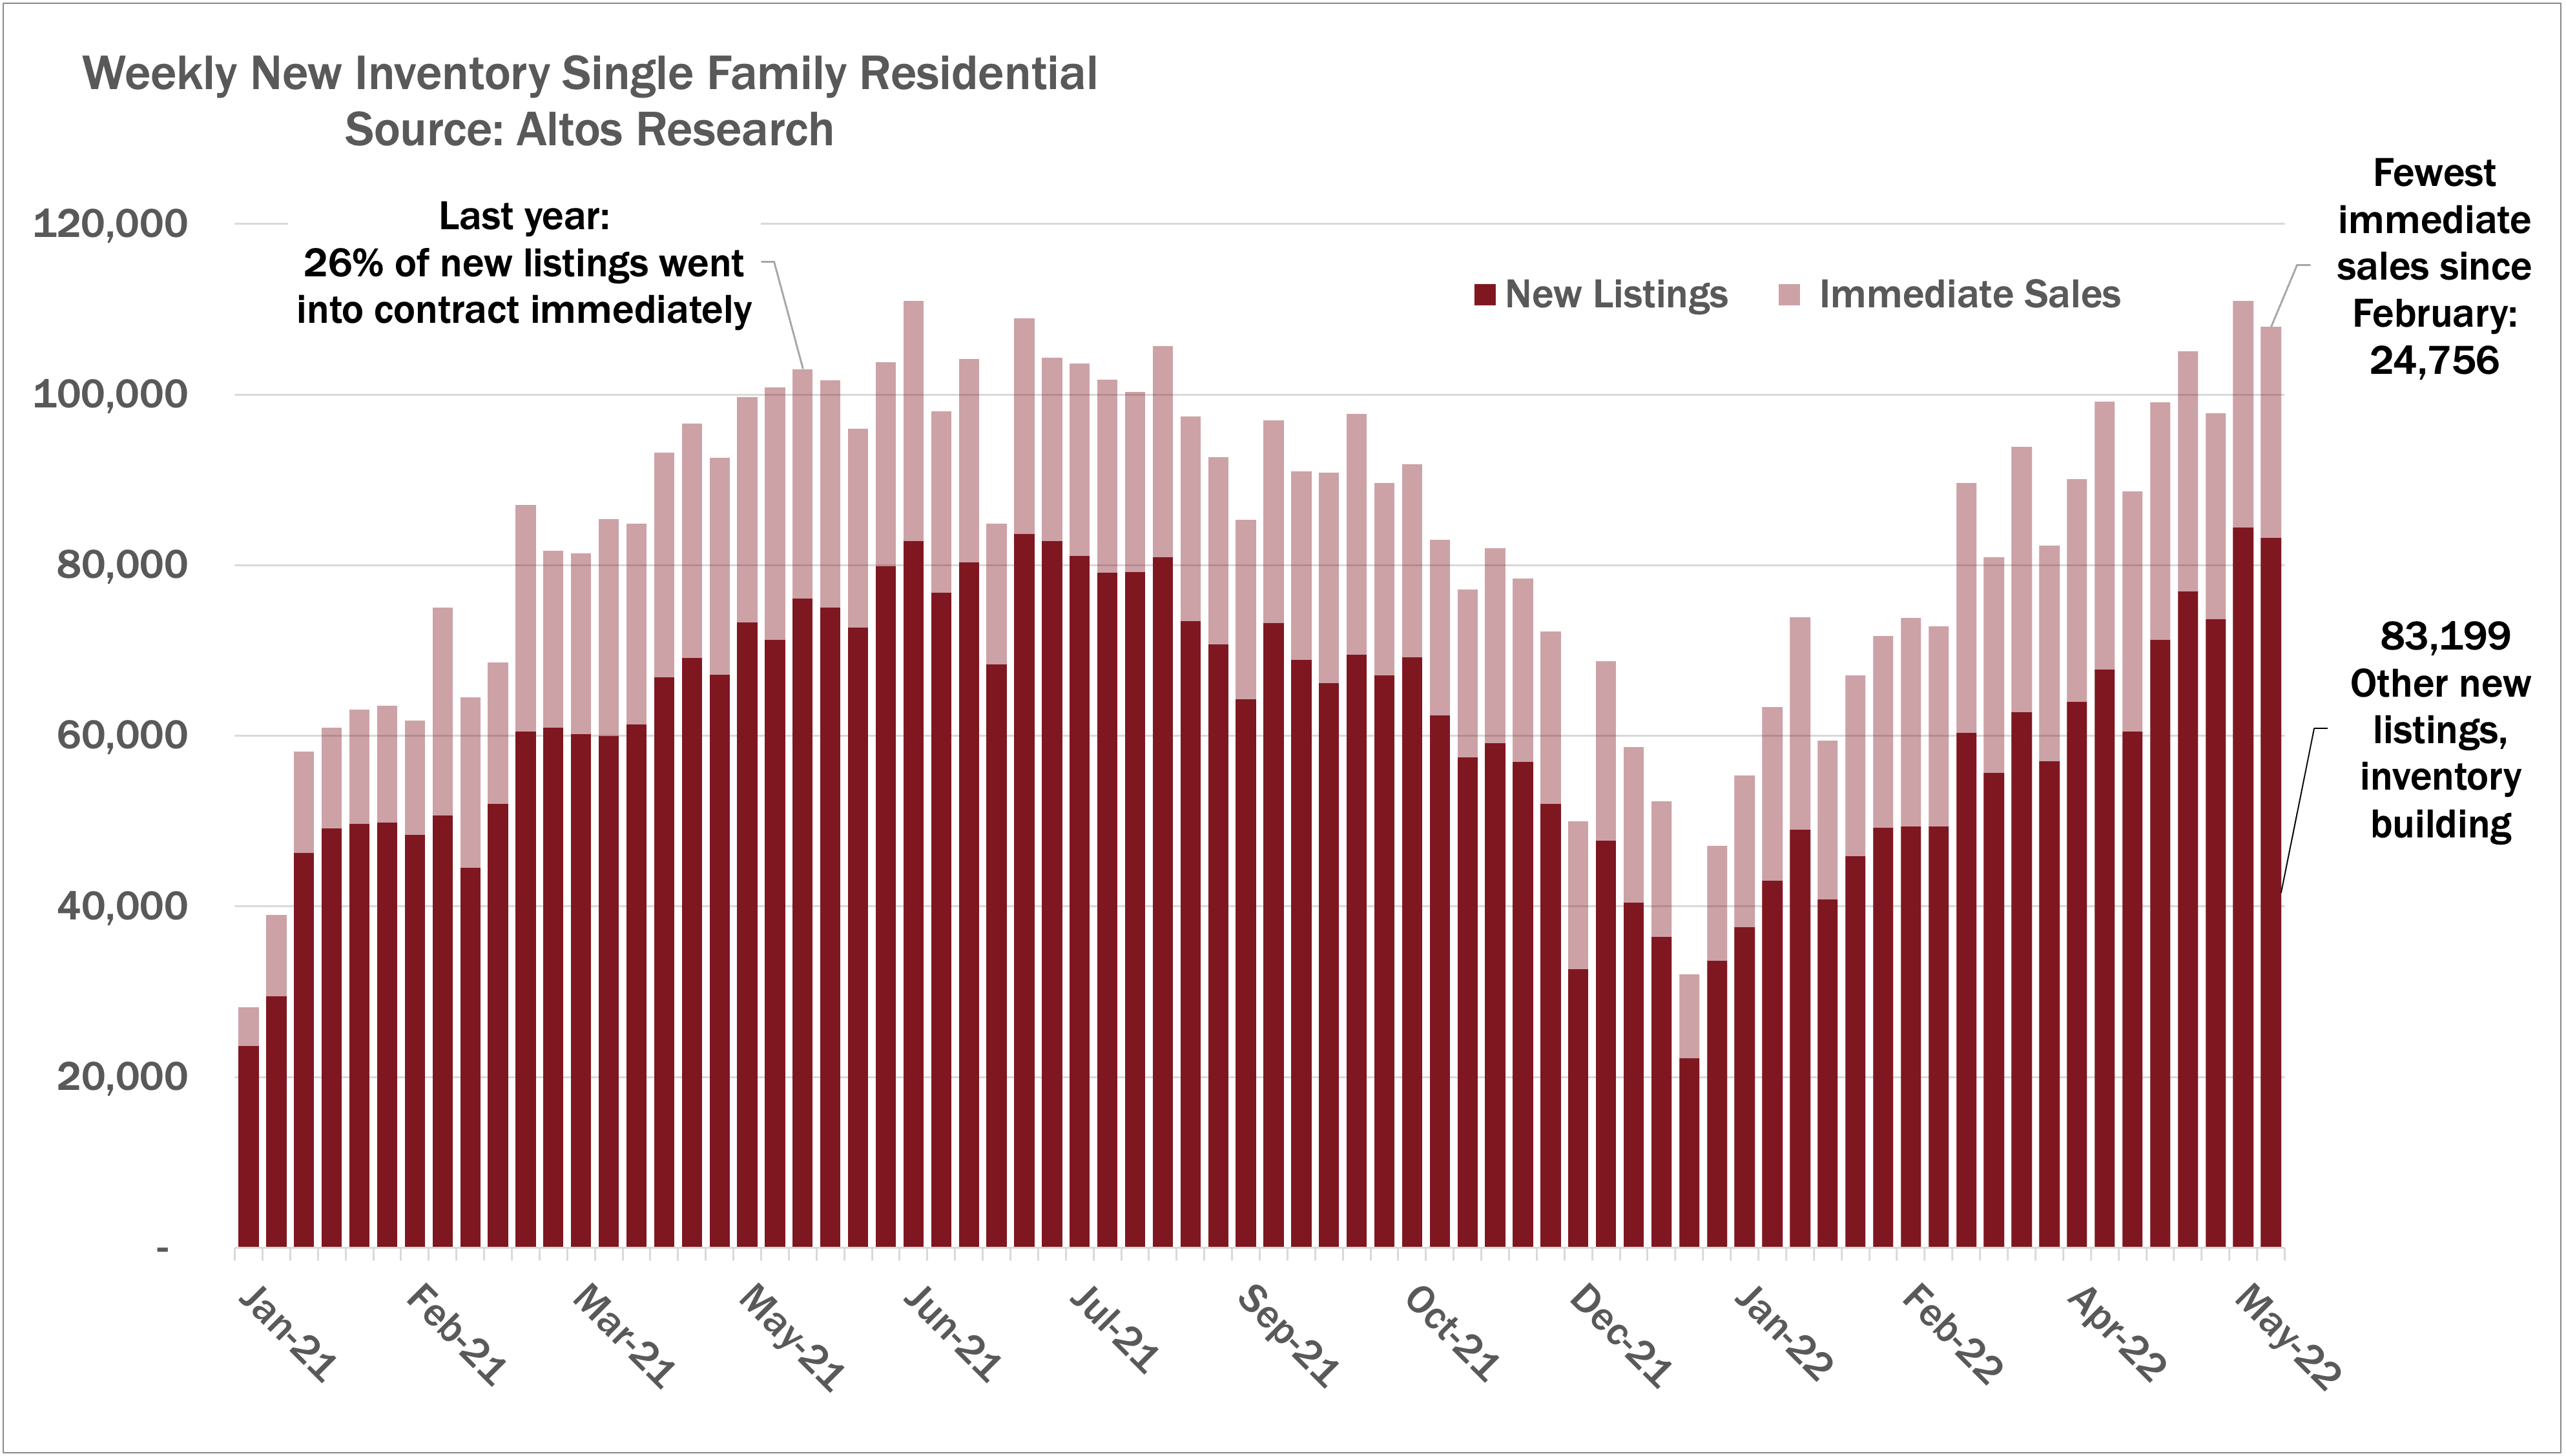
And you can see the inventory build in the immediate sales tracker. This week 25,000 homes went into contract essentially immediately after they were listed. That’s 23% of all the new listings. The light colored portion of the line here is fewer than last week and fewer than last year. Still a lot of homes with multiple offers, selling immediately. It’s is a signal of slight cooling but not by any means a sign of crash.
Immediate Sales Tracker
I’ve been saying for 6 months the immediate sales tracker should be where we see any slowdown first. A market with this many immediate sales is purely a function of the frenzy we’ve been in the last two years. It has to come down. But it’s hard to visualize the changes in that light colored bar.
So here is a chart of the percent of the market selling immediately. This is over last year and this year.
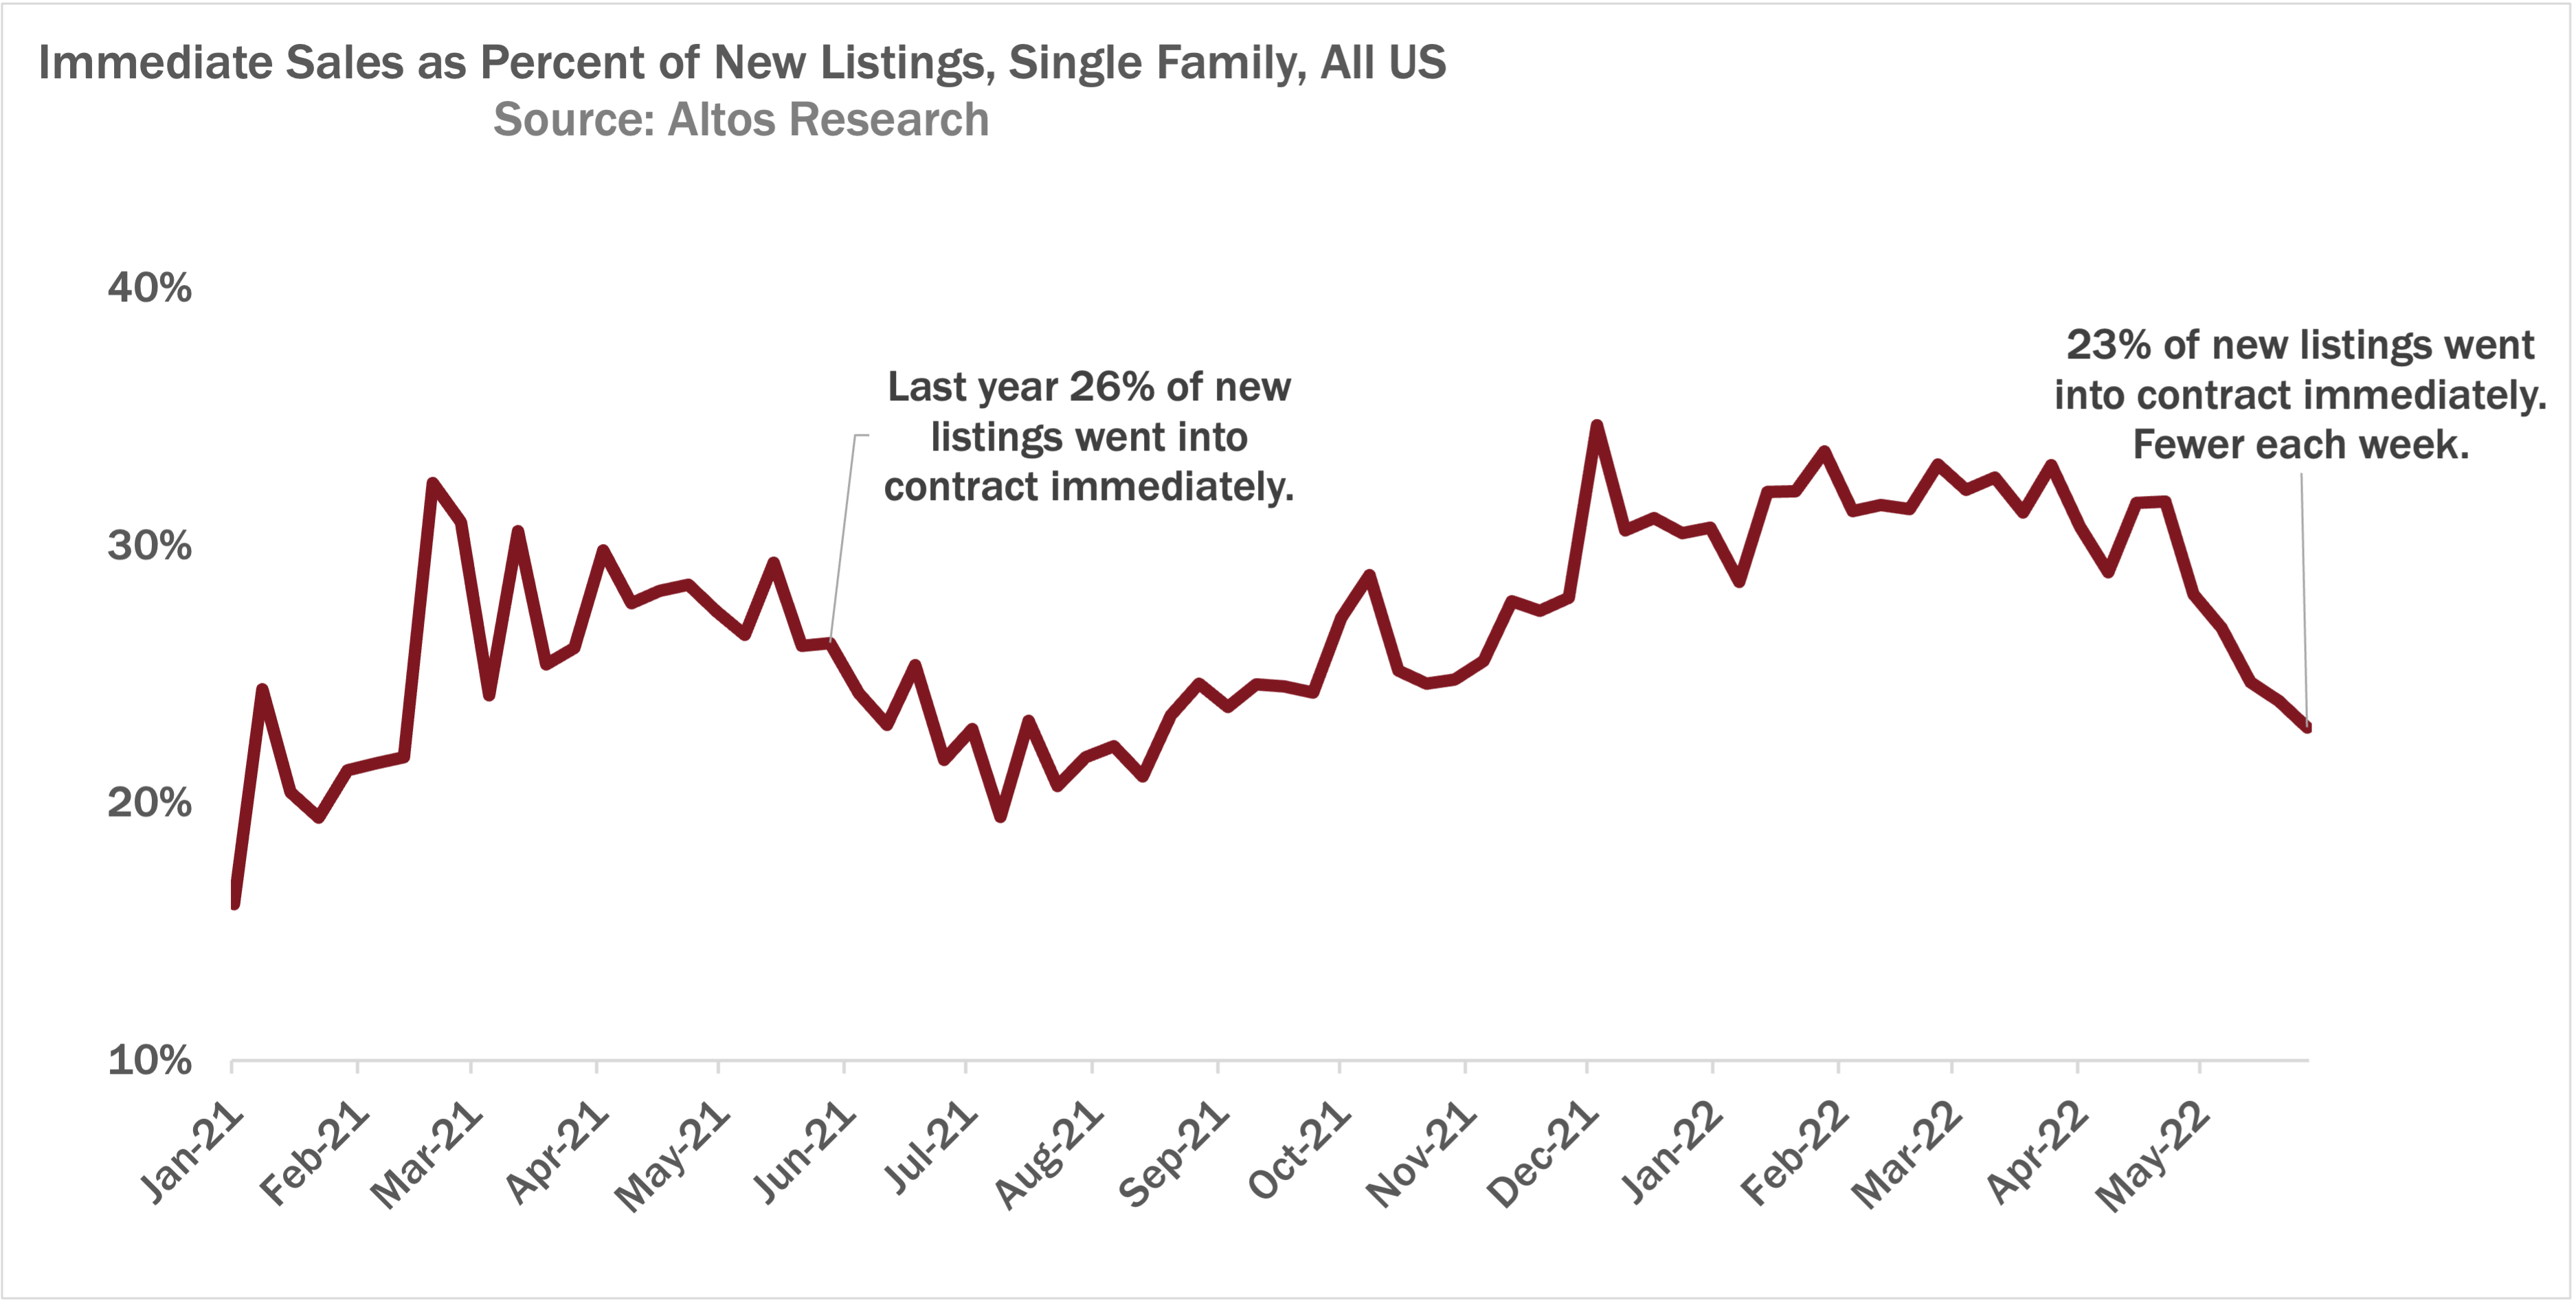
You can see last year’s seasonal peak in March and April. This year though look at the right side of the chart. Each week for the last six weeks fewer and fewer immediate sales. This is a very clear trend. We only started tracking this phenomenon last year so I don’t have a sense of “normal” levels, but there are always some. Maybe it’s 5-10% of the market. We’ll see. What this means though is that by July and August there are going to be some very surprised sellers. Sellers that overpriced and weren’t well guided by their realtor. And they didn’t get the immediate offers they were expecting. You can use this chart as a frenzy tracker. How quickly are we coming out of the frenzy?
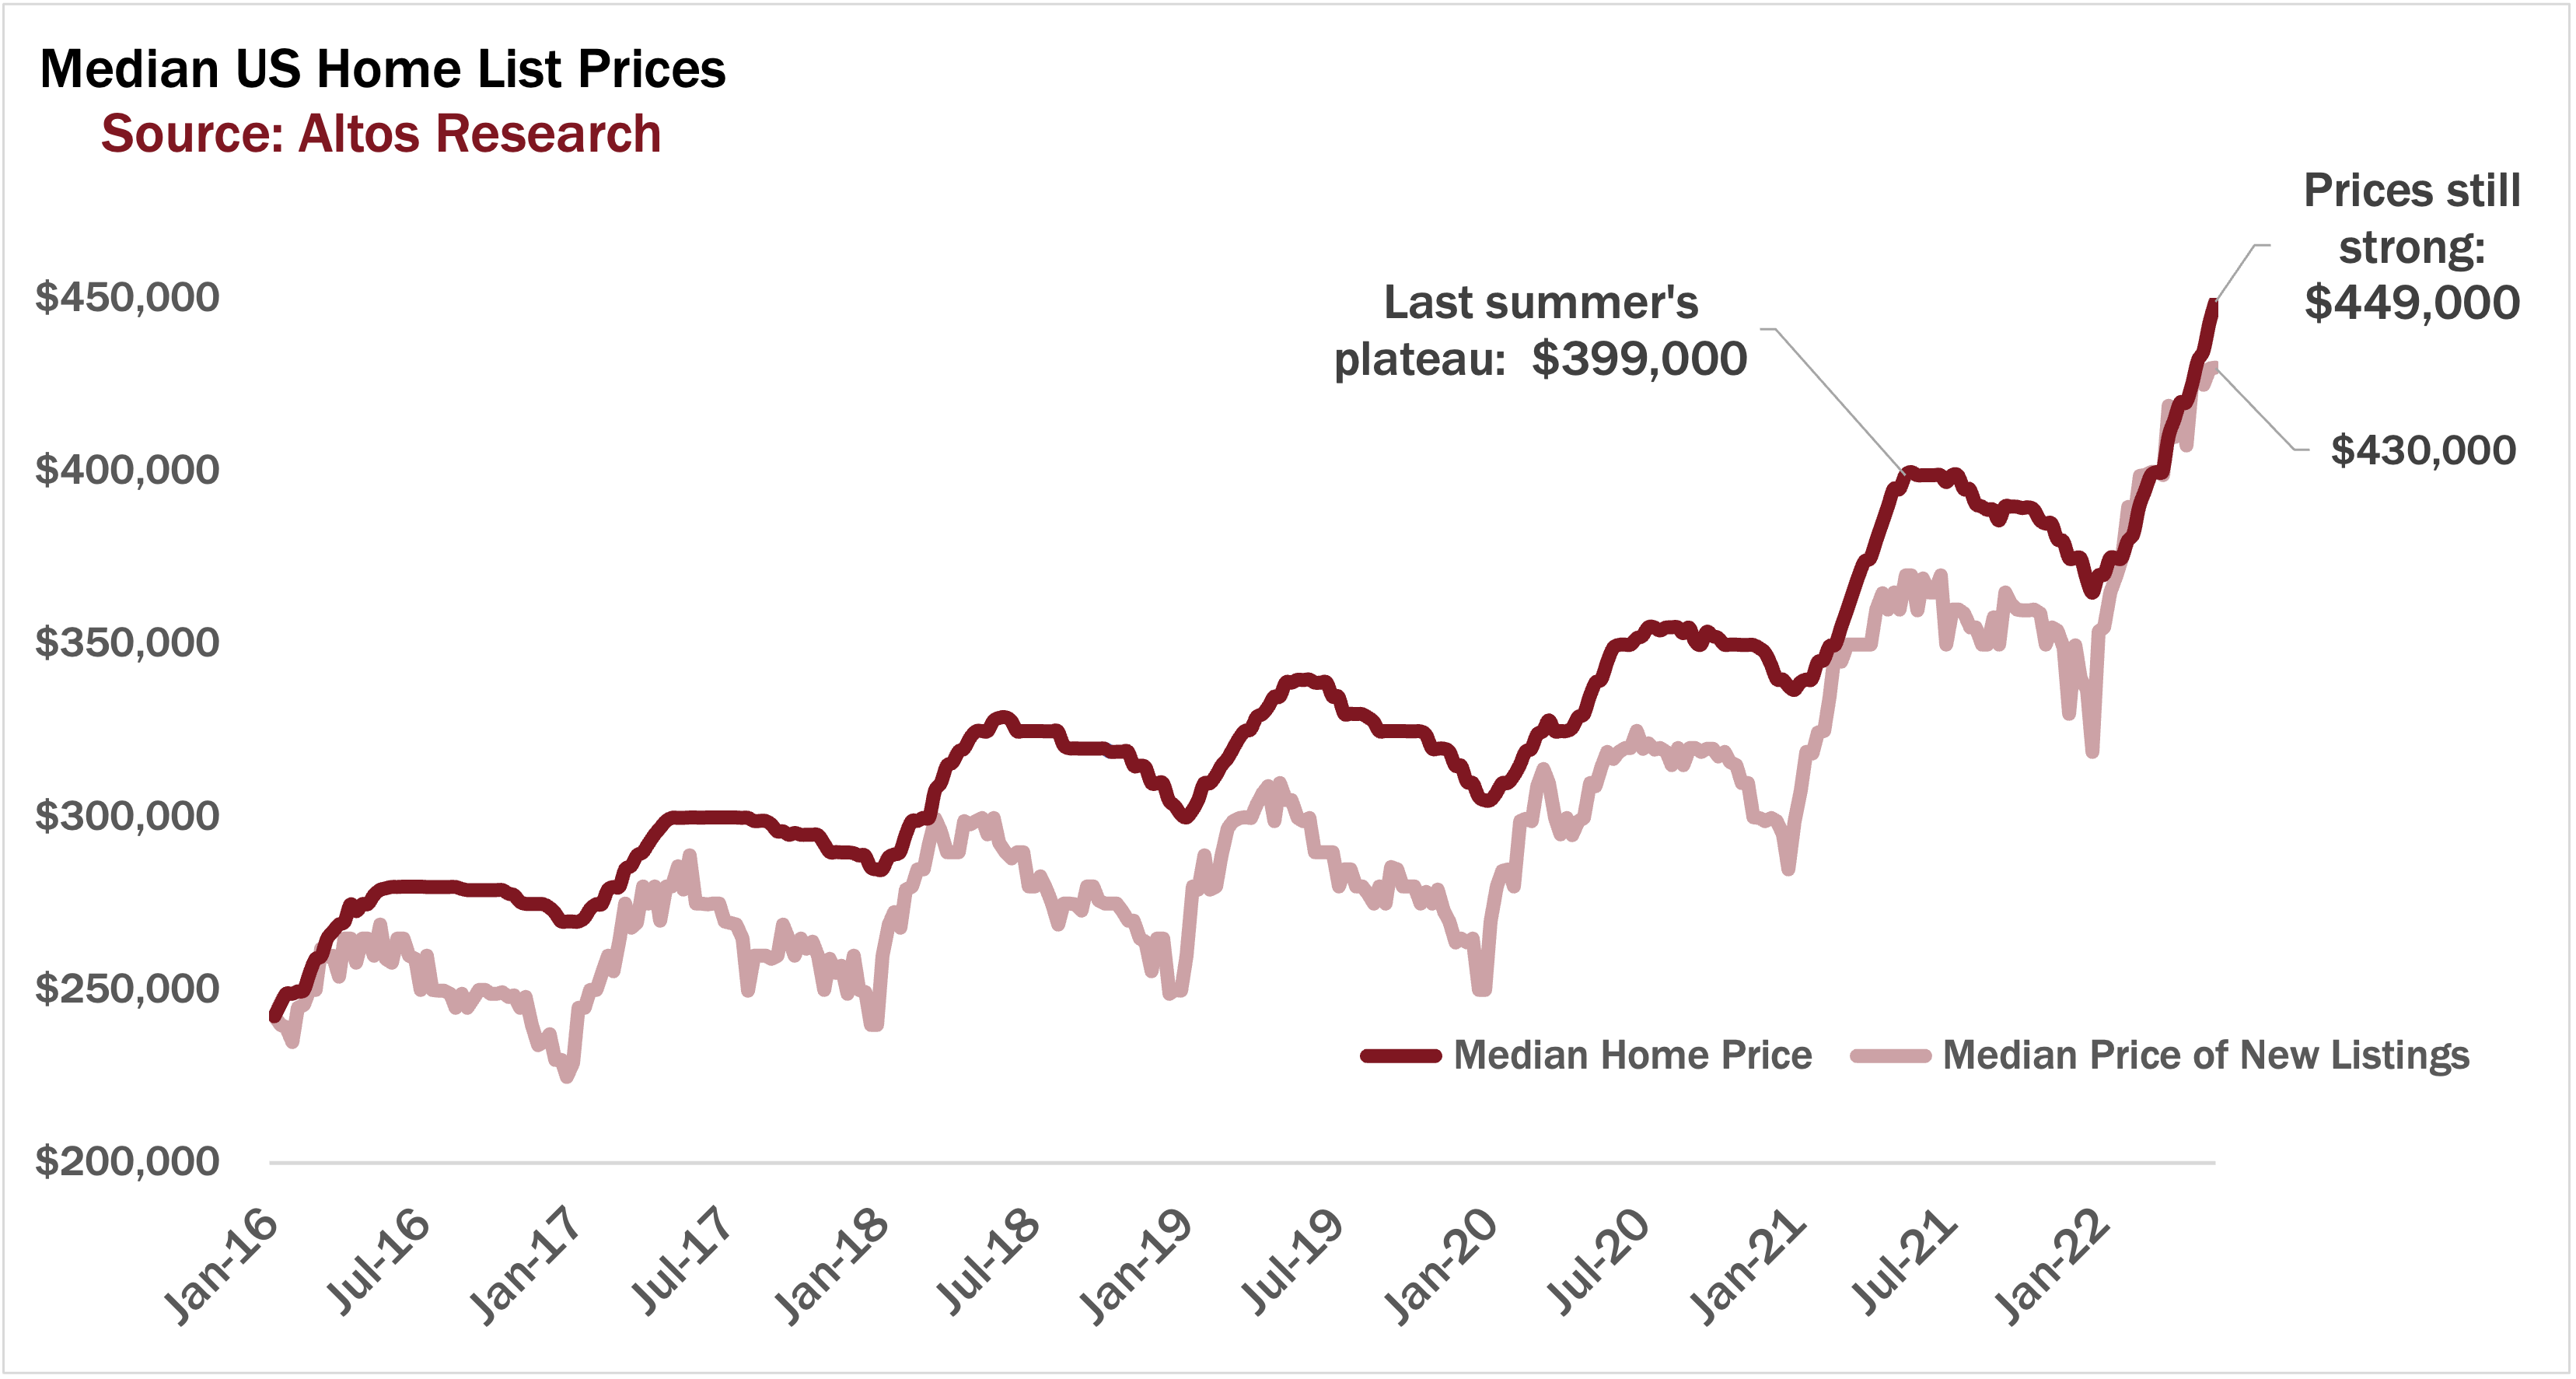
And look, we know the demand is there because prices are still holding up. I expected prices to plateau around $440,000 but it looks like we’re going to settle at the $450,000 range for the summer. I suppose that’s because $450k is a big psychological barrier so prices tend to cluster just under that. The price strength we’re measuring jibes with the anecdotal evidence we’re hearing from the boots on the ground realtors. 5 bidders not 50, but 5 means houses are still very often selling over asking.
Median Price of New Listings
The median price of the new listings this week is $430,000, which is also strong for this leading indicator of transaction prices that will happen in the future. That’s the light red line.
Remember that good selling agents now are informing their sellers that the homes which are priced properly are still going into contract very quickly. Those that are overpriced when they list are the ones most at risk. That advice shows up in the price of new listings data - the light red line here. If sellers were witnessing true weakness, they’d set their initial asking price just a little lower. That change simply hasn’t happened yet.
Price Reductions
For that trend, watching the price reductions is exciting. For the homes that over priced when they listed, they have to take a price cut. This week price reductions across the US rose to 23.1% of the market. See this year’s dark red line compared to the previous years. Normally 30% of the market would have a price cut right now.
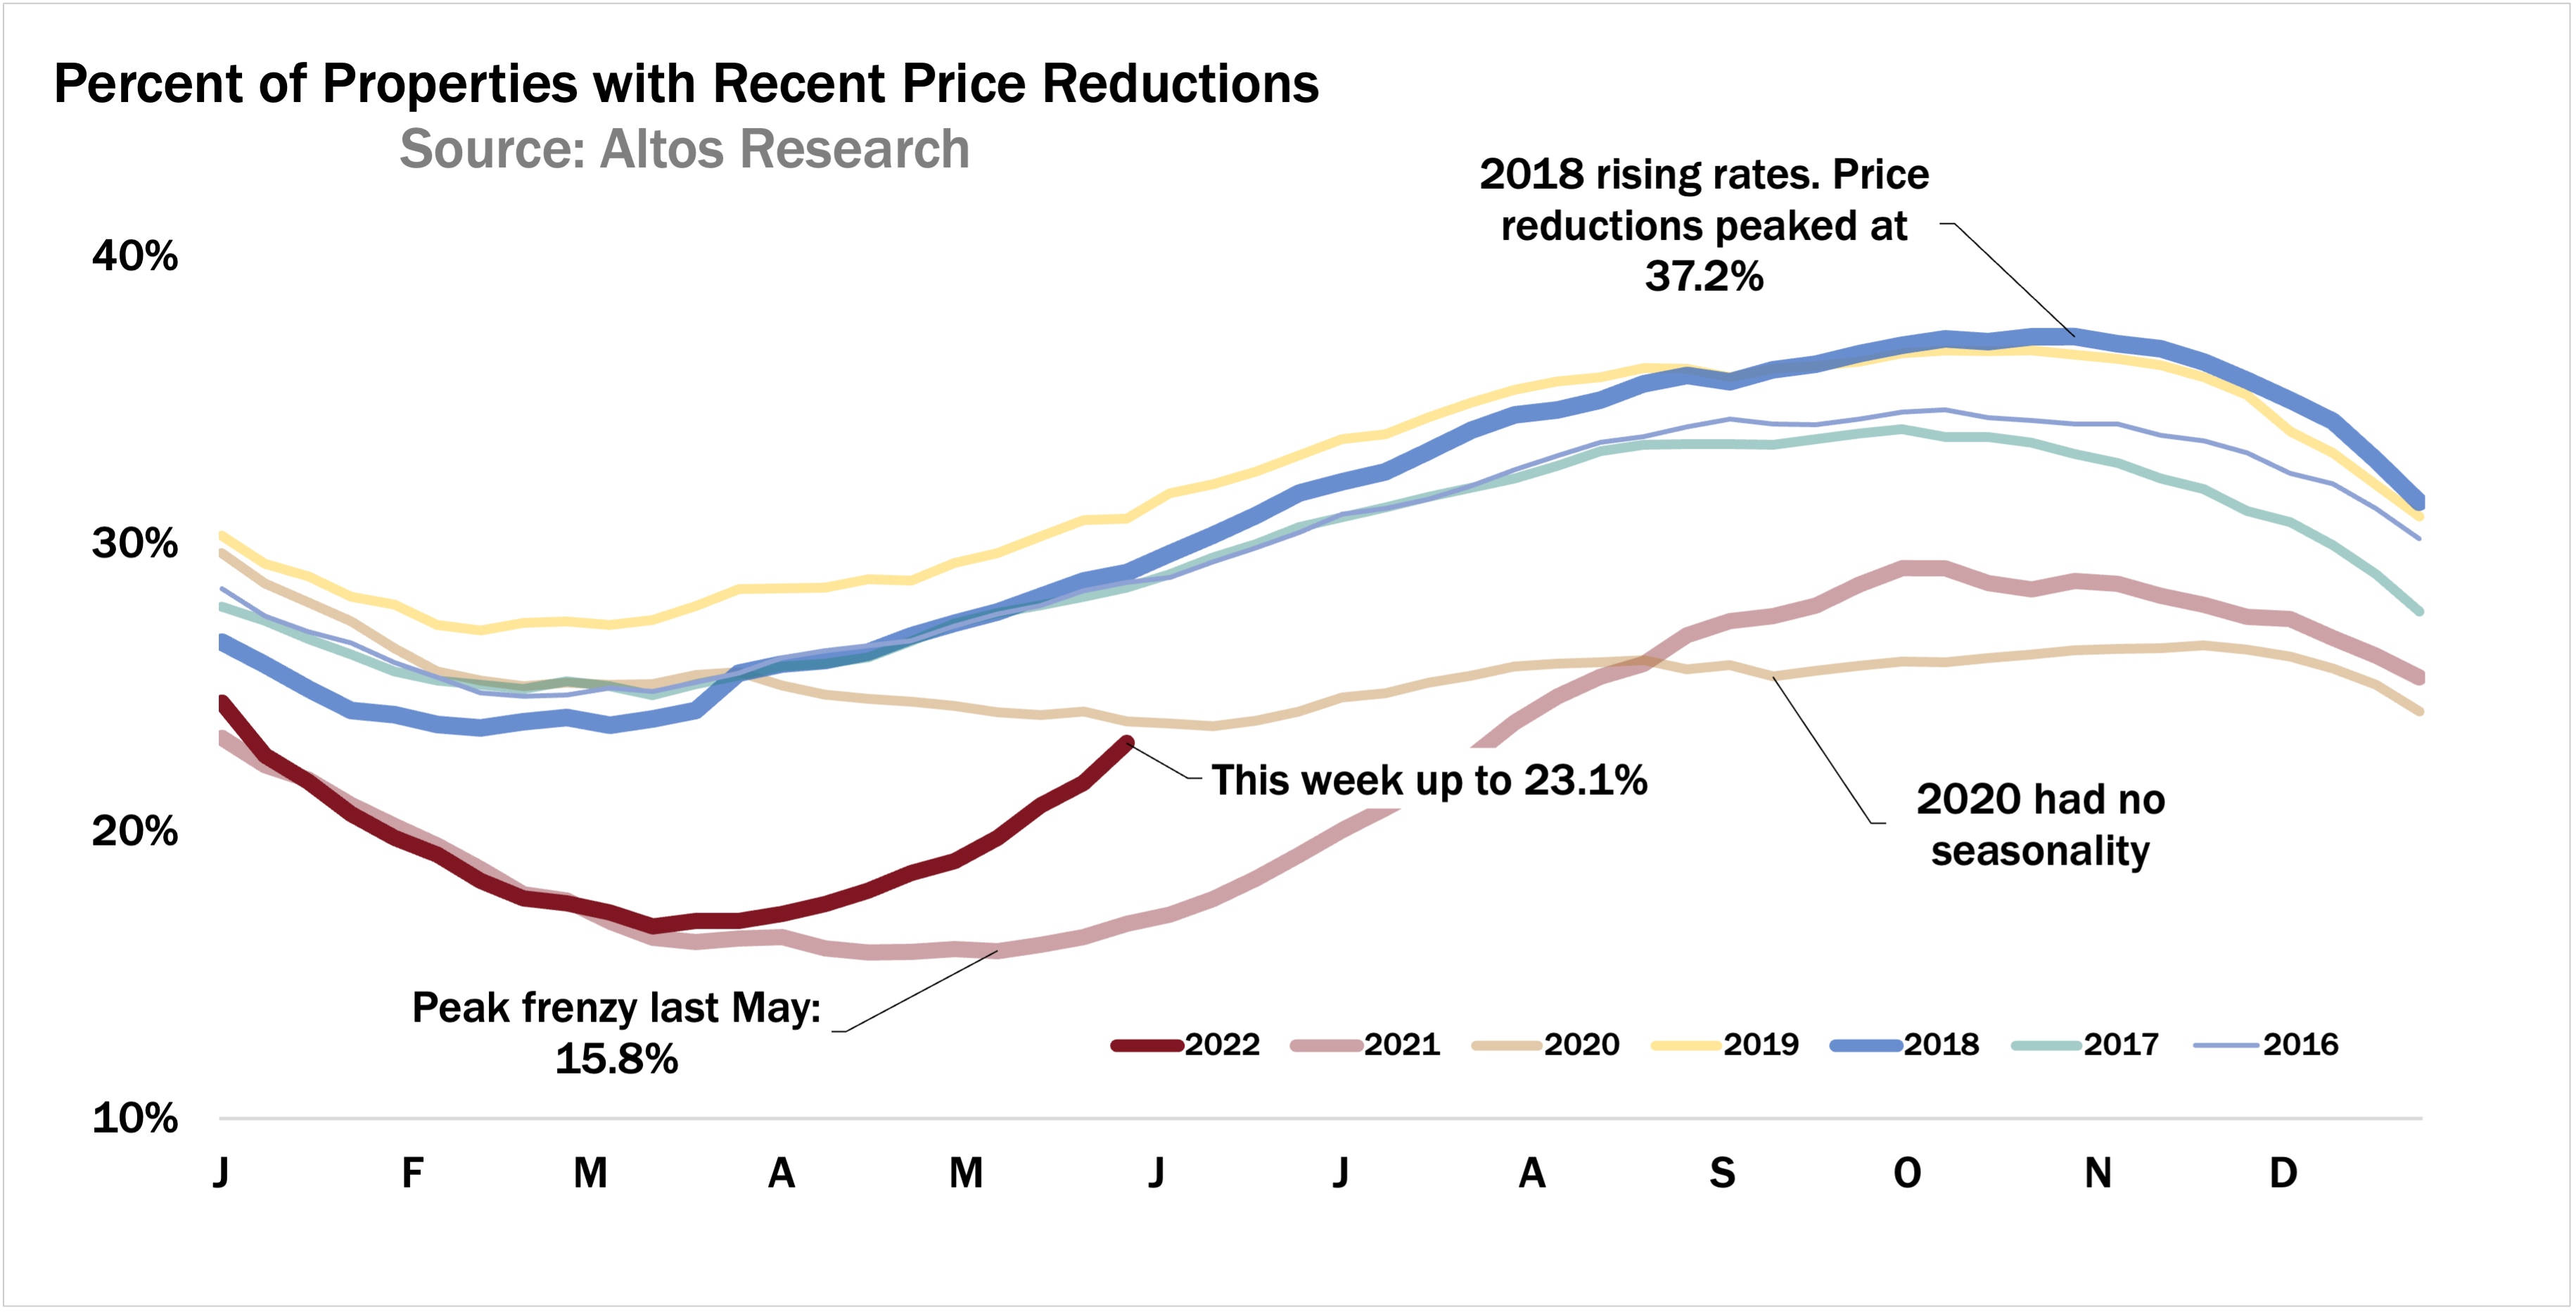
This again shows us that plenty are still moving quickly, but the frenzy has passed and we’re rapidly returning to a much more normal pace of market. It looks like we’re on a trajectory to 35% of the market with price cuts by the fall. This is going to feel very slow, very surprising to some sellers who were unprepared.
Agents when you’re counseling your sellers this is one way to communicate with them. Yes, the market is still strong price reductions are fewer than normal, but it’s changing quickly, so let’s do this right, set the proper price so we don’t get behind this curve. If you need to have these conversations with clients, go to AltosResearch.com and sign up now so you can have your data in the hands of your potential sellers and buyers today.