
Mike Simonsen
Mike Simonsen is the founder and president of real estate analytics firm Altos Research, which has provided national and local real estate data to financial institutions, real estate professionals, and investors across the country for more than 15 years. An expert trendspotter, Mike uses Altos data to identify market shifts months before they hit the headlines.
This last week was the Memorial Day holiday in the US and as usual, the housing market does a minor pause. There’s a bigger pause during the July 4th holiday week, but a little one for Memorial Day. So inventory grew at a slower rate and prices are at their summer plateau now. But the big trend right now is price reductions. We’re watching how many homes across the country need to cut their asking price before they get the offers they need.
When we talk about price reductions remember that these are not homeowners who are losing money, they’re not underwater, these are sellers who were trying to maximize their profit when they sell and they probably just overshot a little. Price reductions are a leading indicator of transactions that will happen out in the future. A house that is listed now and doesn’t see any offers reduces its asking price. Then in July they get their offer. The sale closes in August or September. That sale gets reported in October and November. But we can see right now what’s happening.
Every week Altos Research tracks every home for sale in the country. We analyze all the pricing, supply and demand, and all the changes in that data and we make it available to you before you see it in the traditional channels. If you aren’t using Altos market reports with your clients. Your buyers and sellers, now might be the time to step up. Go to AltosResearch.com and book a free consult with our team. Because everyone is worried about what’s happening right now.
I’m Mike Simonsen, I’m the CEO of Altos Research. Here’s what we’re looking at for the week of June 6 2022.
Home Price Reductions
So let’s start with price reductions. The percent of homes on the market that have had asking price reductions is up to 24.1% this week, that’s the highest level of 2022. As always with price reductions, it’s important to keep this in perspective. Normally across the country about a third of the homes on the market take a price cut before they sell. Right now we’re only at 24%. Fewer price cuts are because we have had such a hot market. But you can see the dark red line here is climbing quickly we have lots more price reductions than last year and more than this time in 2020 also, as the pandemic buying frenzy was just kicking in.
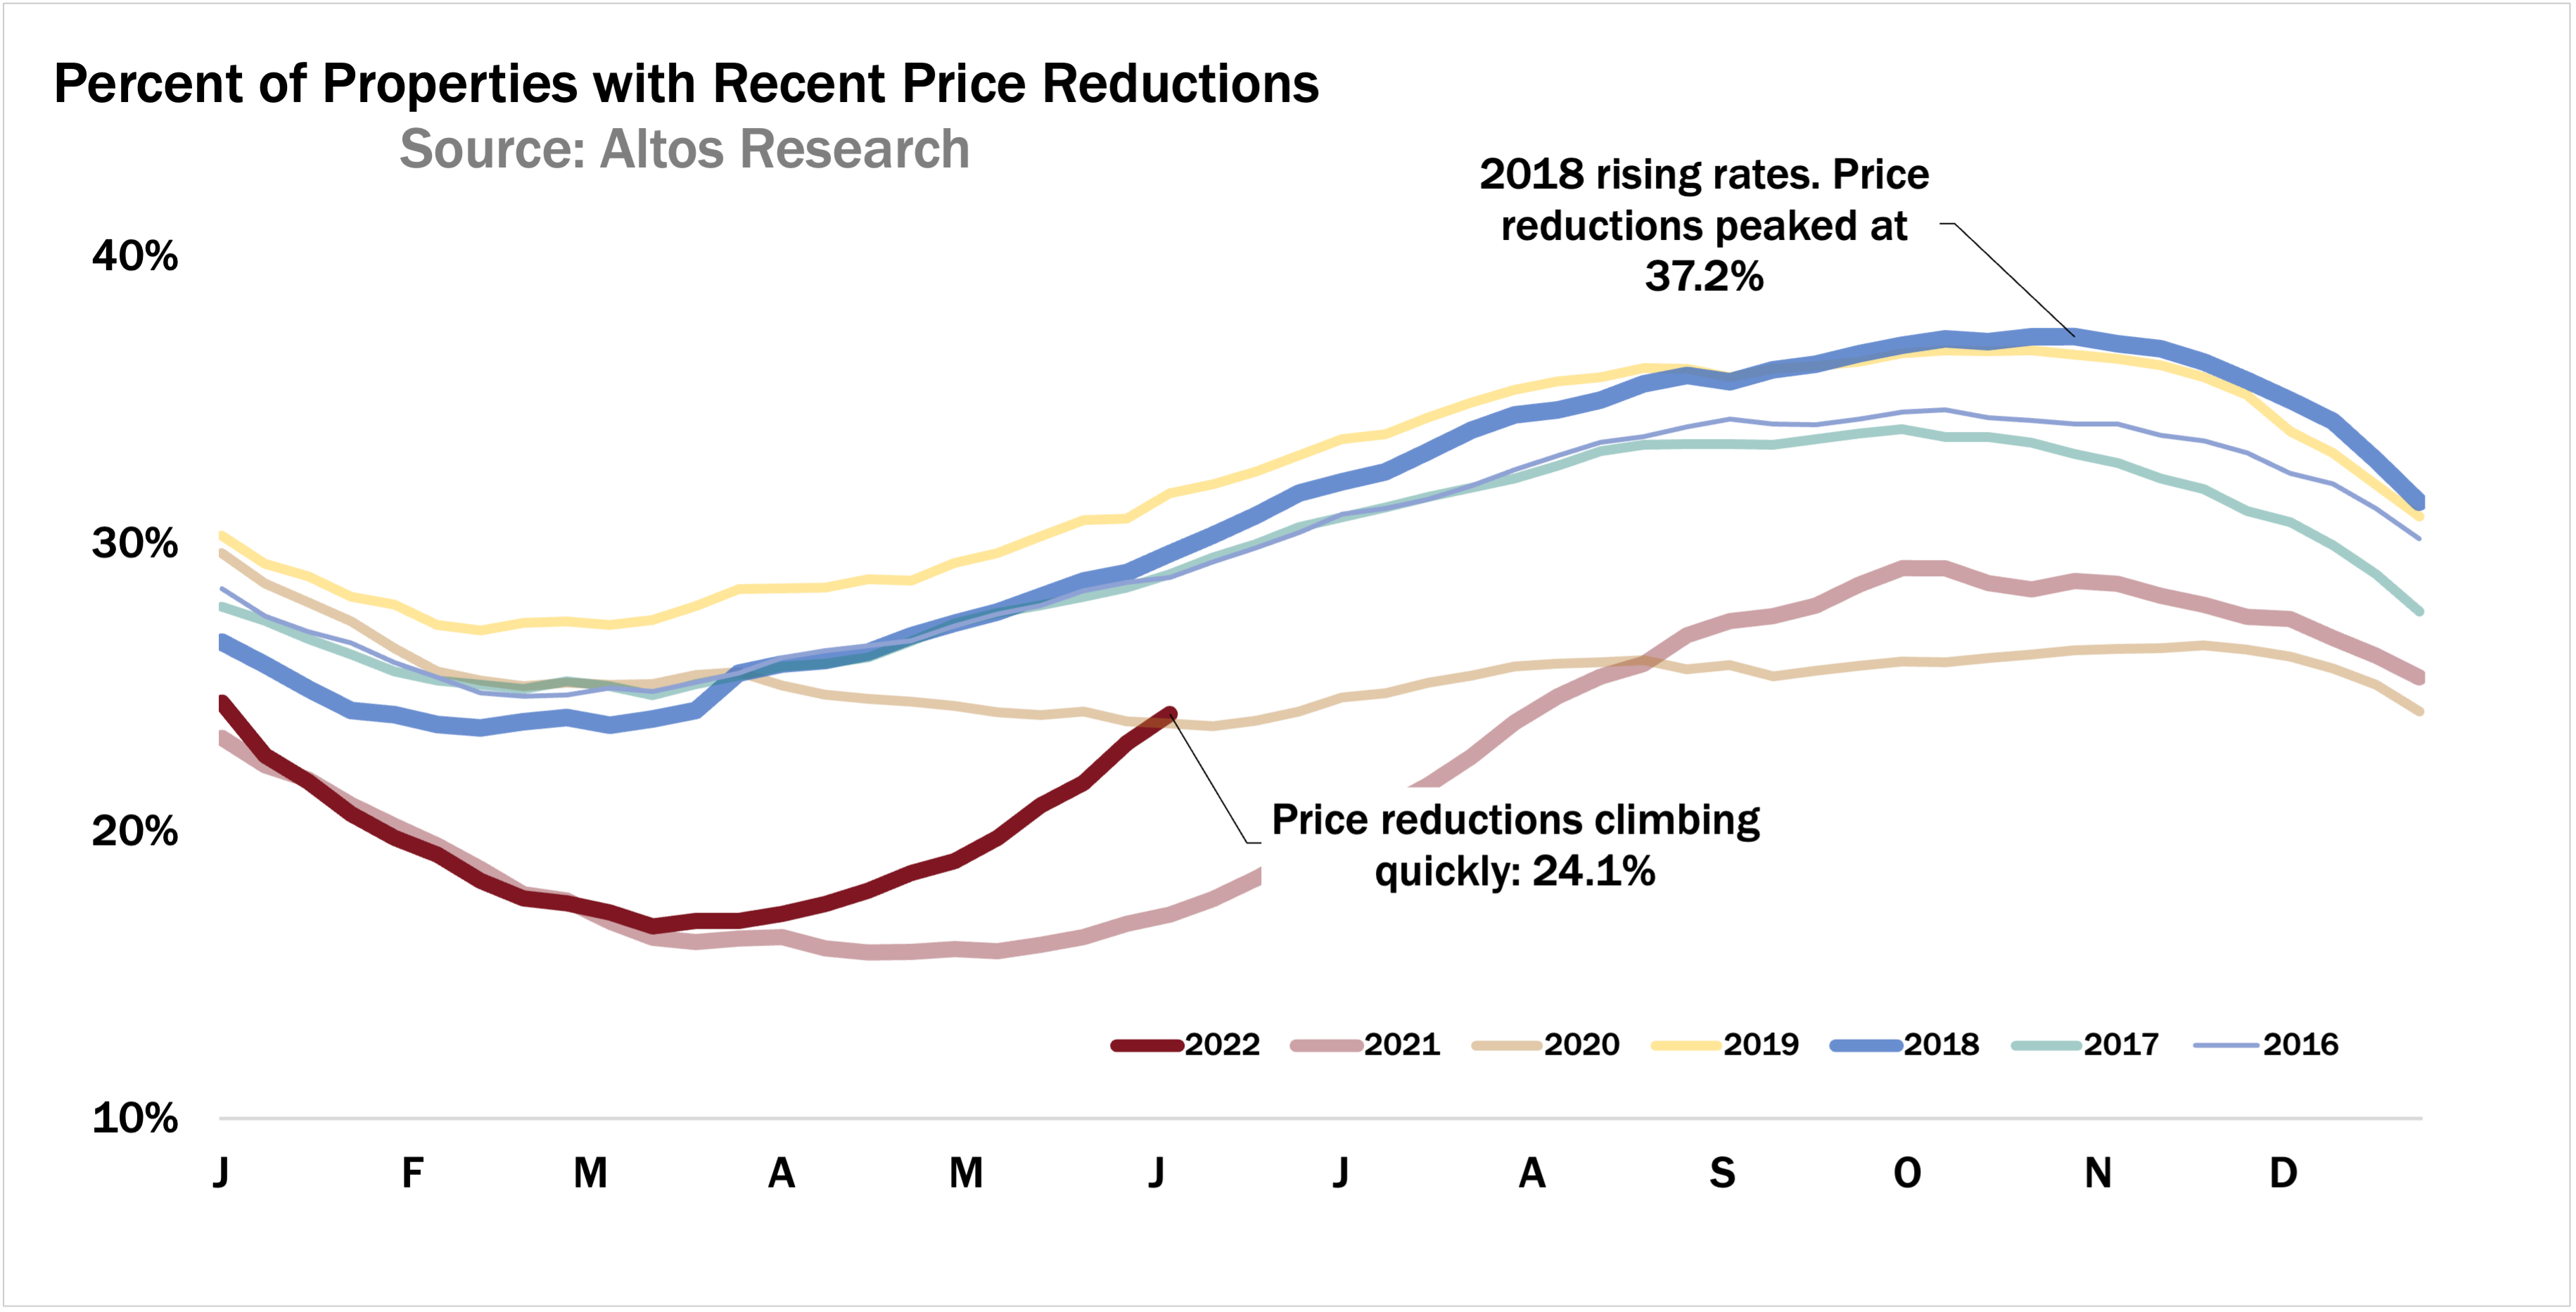
Each line on this chart is a year. Price reductions always climb in the second quarter, which is happening now. If you listed in April and didn’t get your offer, you cut your price to try to move the house before summer gets too far along. Price reductions peak in the fall before resetting with the holidays. Looking at this trajectory, you can see that by July we’ll be back to a normal 30% range price reductions. This will be normal but it will feel slow to sellers who were not properly prepared by their real estate agent.
If you’re new to Altos and are just watching these videos for the first time, I like to point out the dark blue line on this chart. 2018 was the last time we had rising mortgage rates. As the market slowed, price reductions climbed. So 2018 the dark blue line started the year with few price reductions and ended the year with more. That’s the path we’re on now. Though this year is moving bigger than 2018. Because this is a leading indicator of transactions that will happen months in the future, we know that those transactions will generally still have strong home price gains. Just those gains are slower than last year. There’s nothing in the data yet that shows any crash or any home price declines. Just a very notable shift.
By the way, next week Wednesday, June 15 is our monthly webinar. In that webinar we’ll spend time on looking at price reductions across local markets. We take the time to look beyond the national trends. Which markets are slowing the most? It’s really interesting to see which of the high speed pandemic boom markets are downshifting first. In these hour long discussions we look at all the leading indicators, and spend some time with the local markets. If you’re working with buyers and sellers right now, they need to know what’s happening so you should join us.
Available Inventory
Available inventory of unsold single family homes rose 3% this week to 375,000. Inventory is climbing quickly but not in a scary amount. 3% increase this week, down from 6% last week and 8% the week before. We have more homes on the market now than last year at this time.
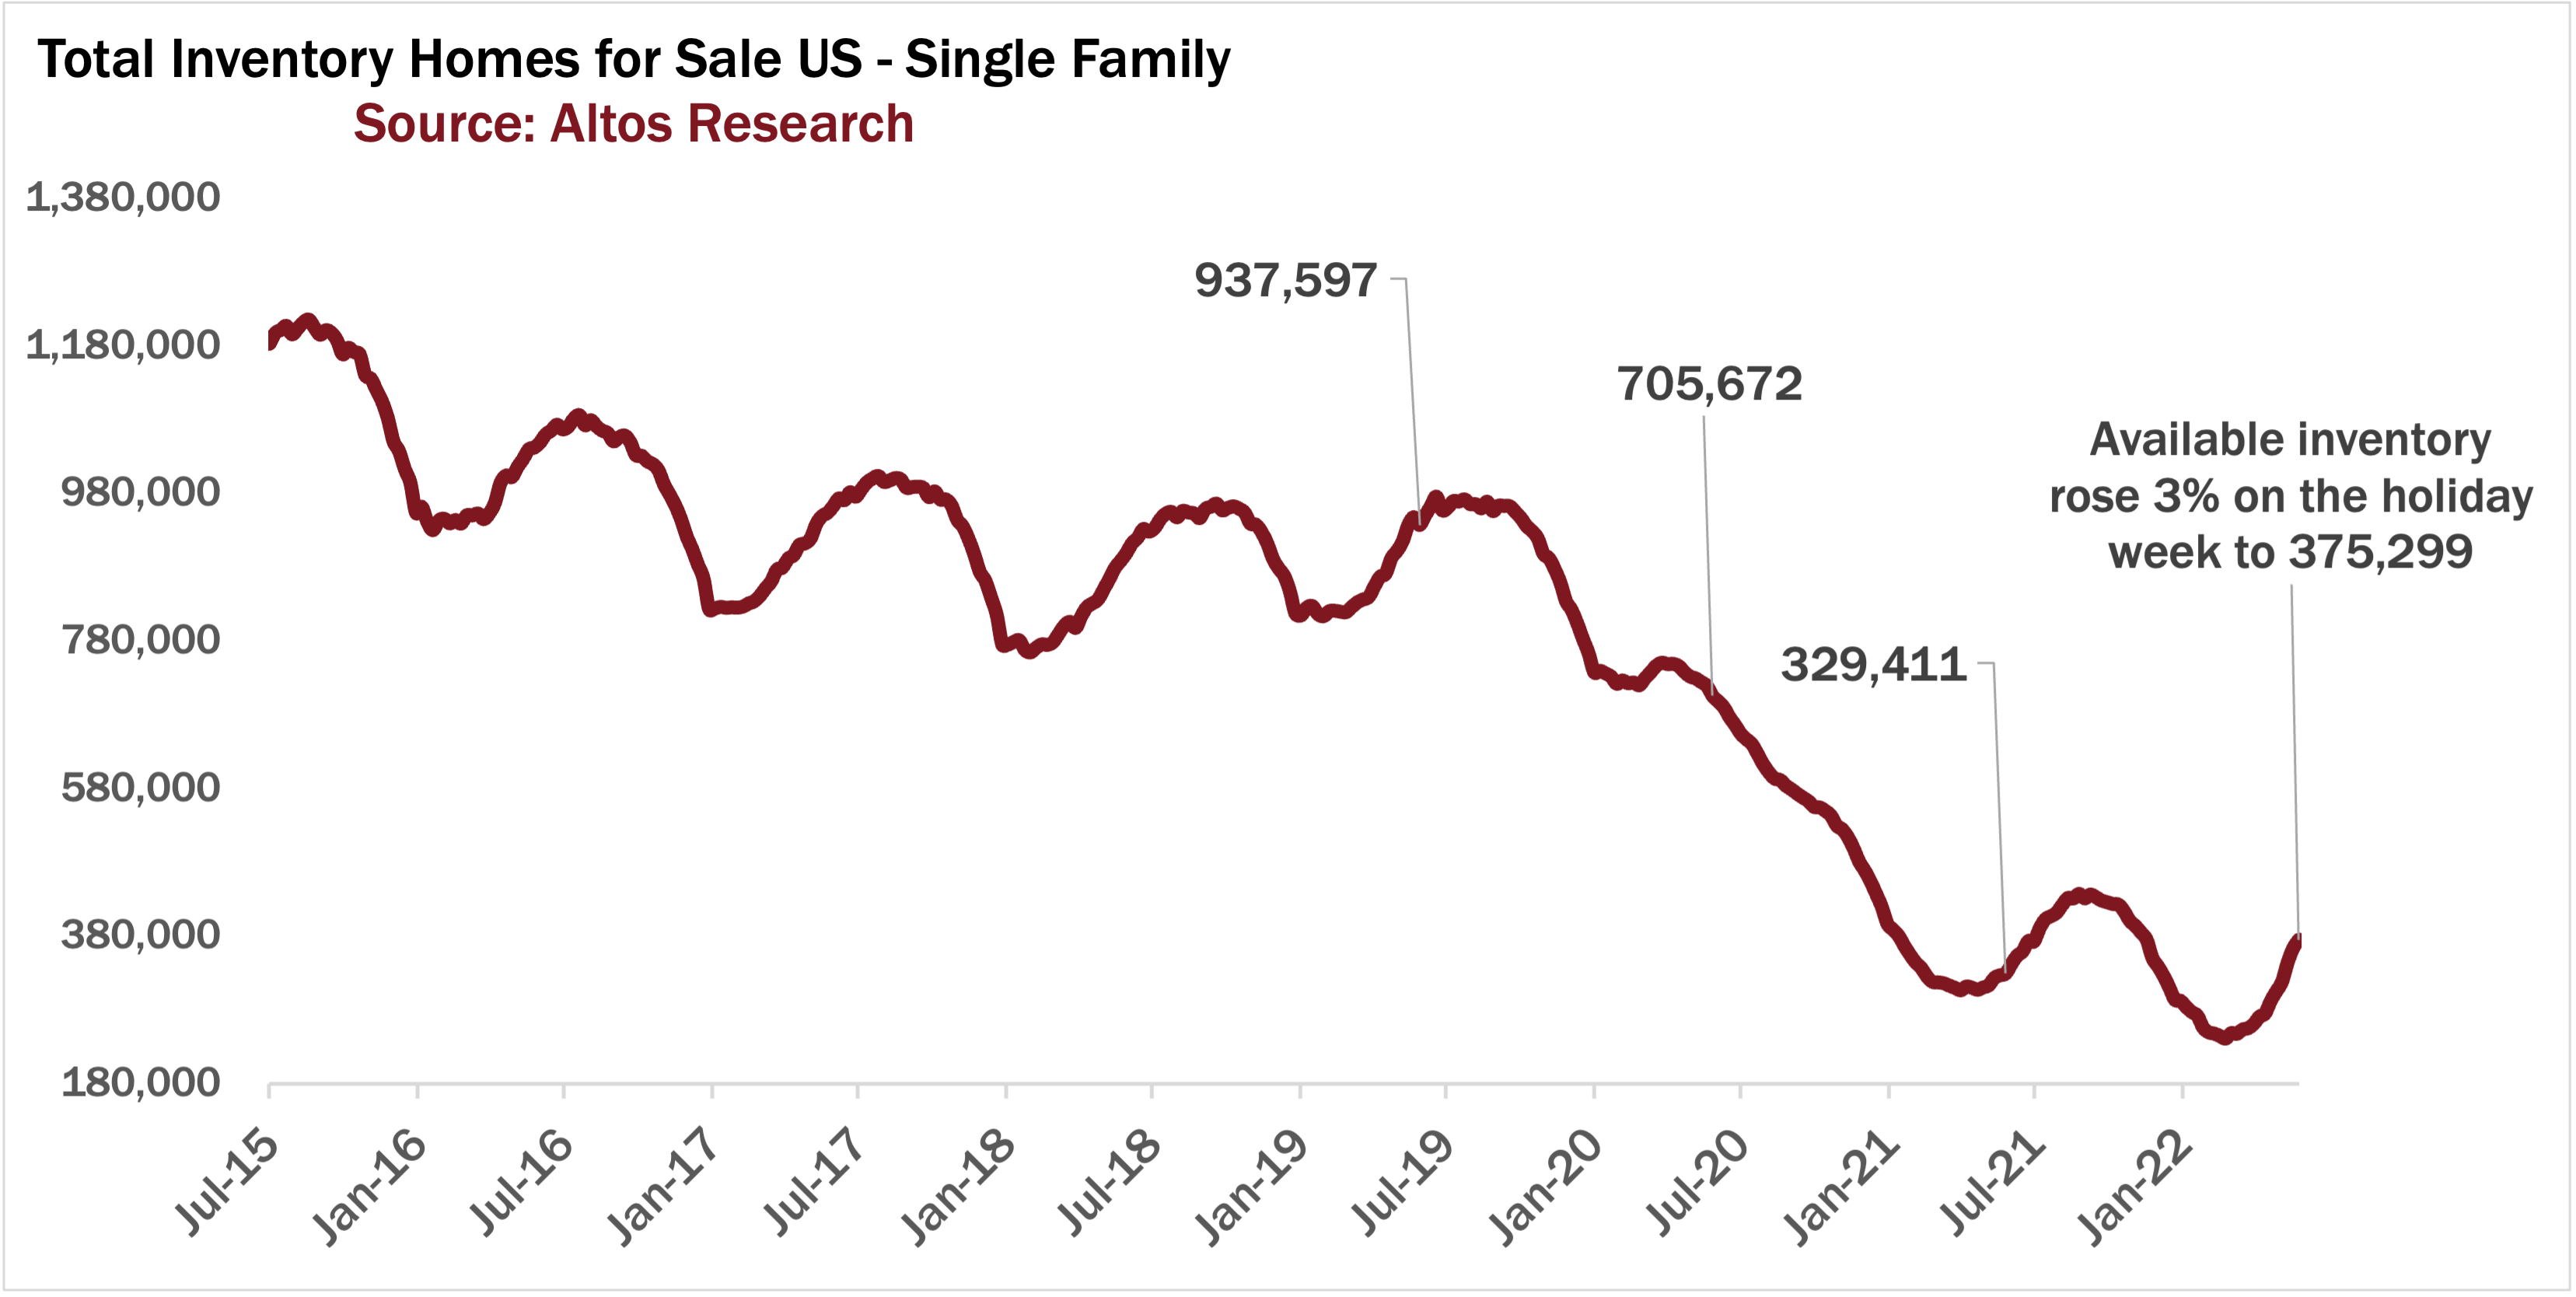
Finally getting some opportunity for buyers. We’re still so far below normal levels of available inventory it’s hard for me to see this trend as anything but good news for the market. Restoring some healthy options for buyers. In the webinar next week we’ll look at the latest inventory forecast models to see how we expect the rest of the year to play out.
Immediate Real Estate Sales Tracker
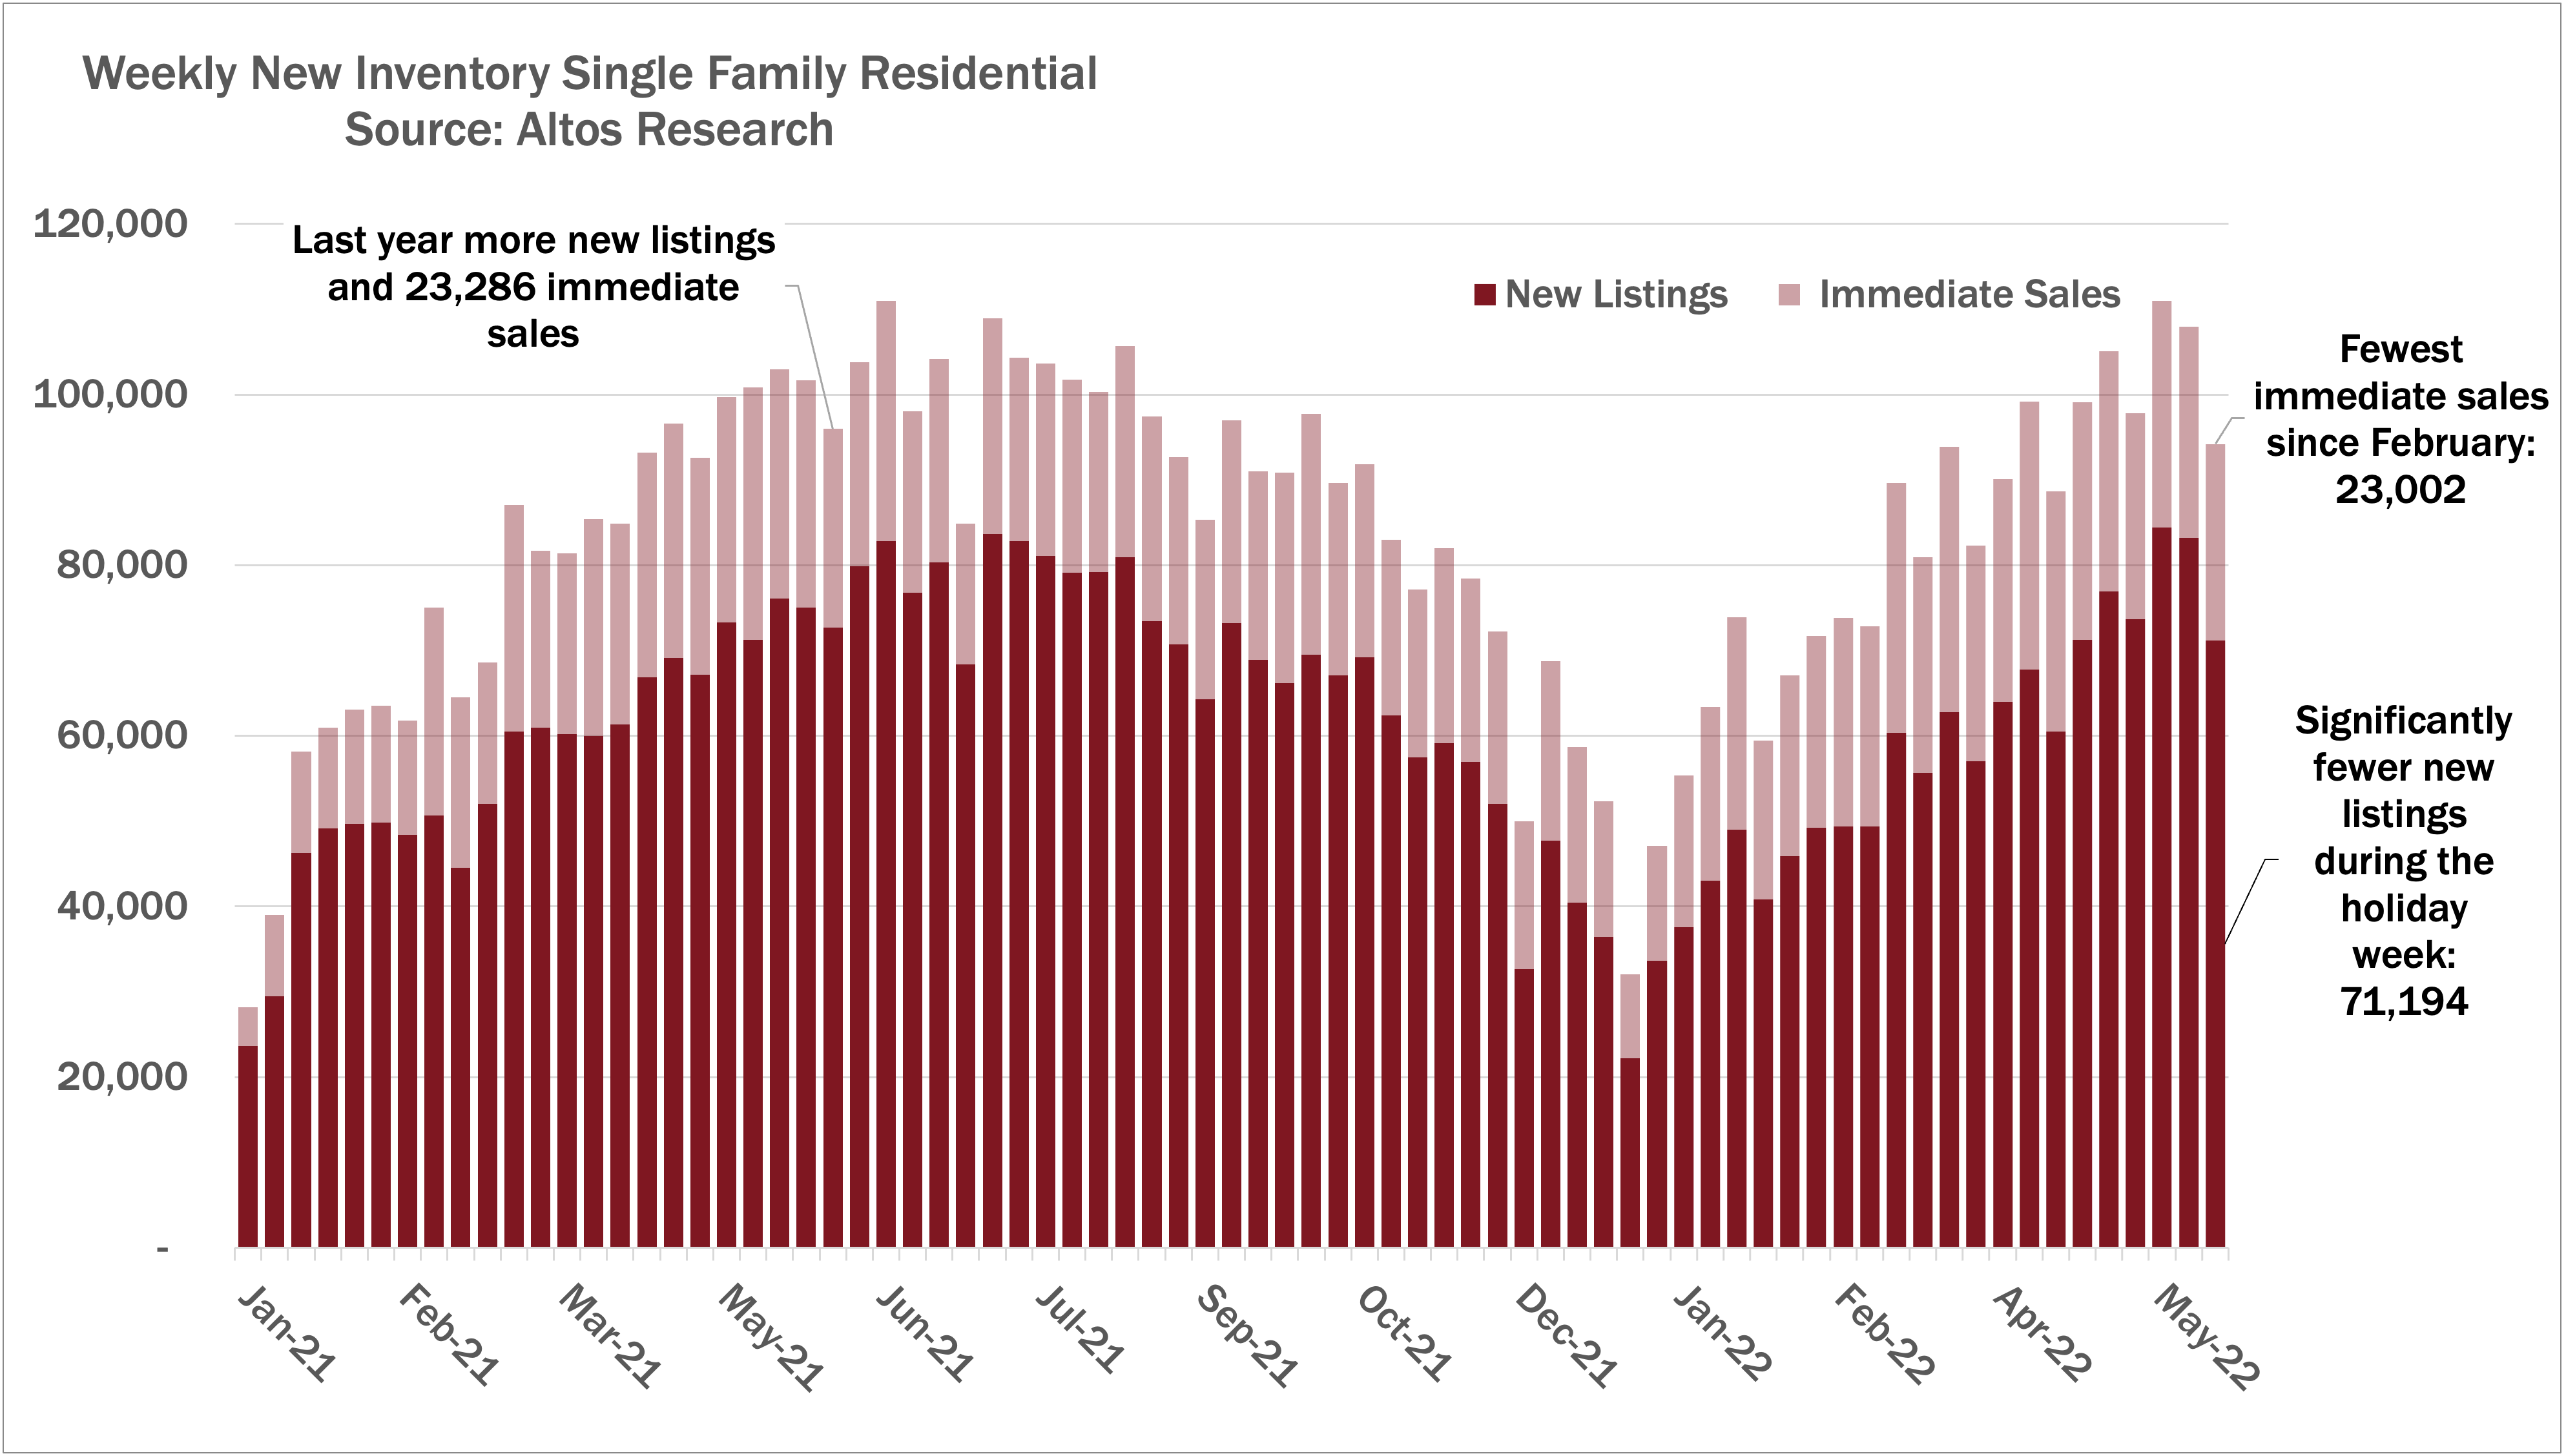
Here’s our immediate sales tracker. We have the fewest immediate sales this week since the winter. 23,000 homes got listed and went into contract essentially immediately. You can see at the far right side of this chart the dip for the holiday week. We have fewer new listings and fewer immediate sales.
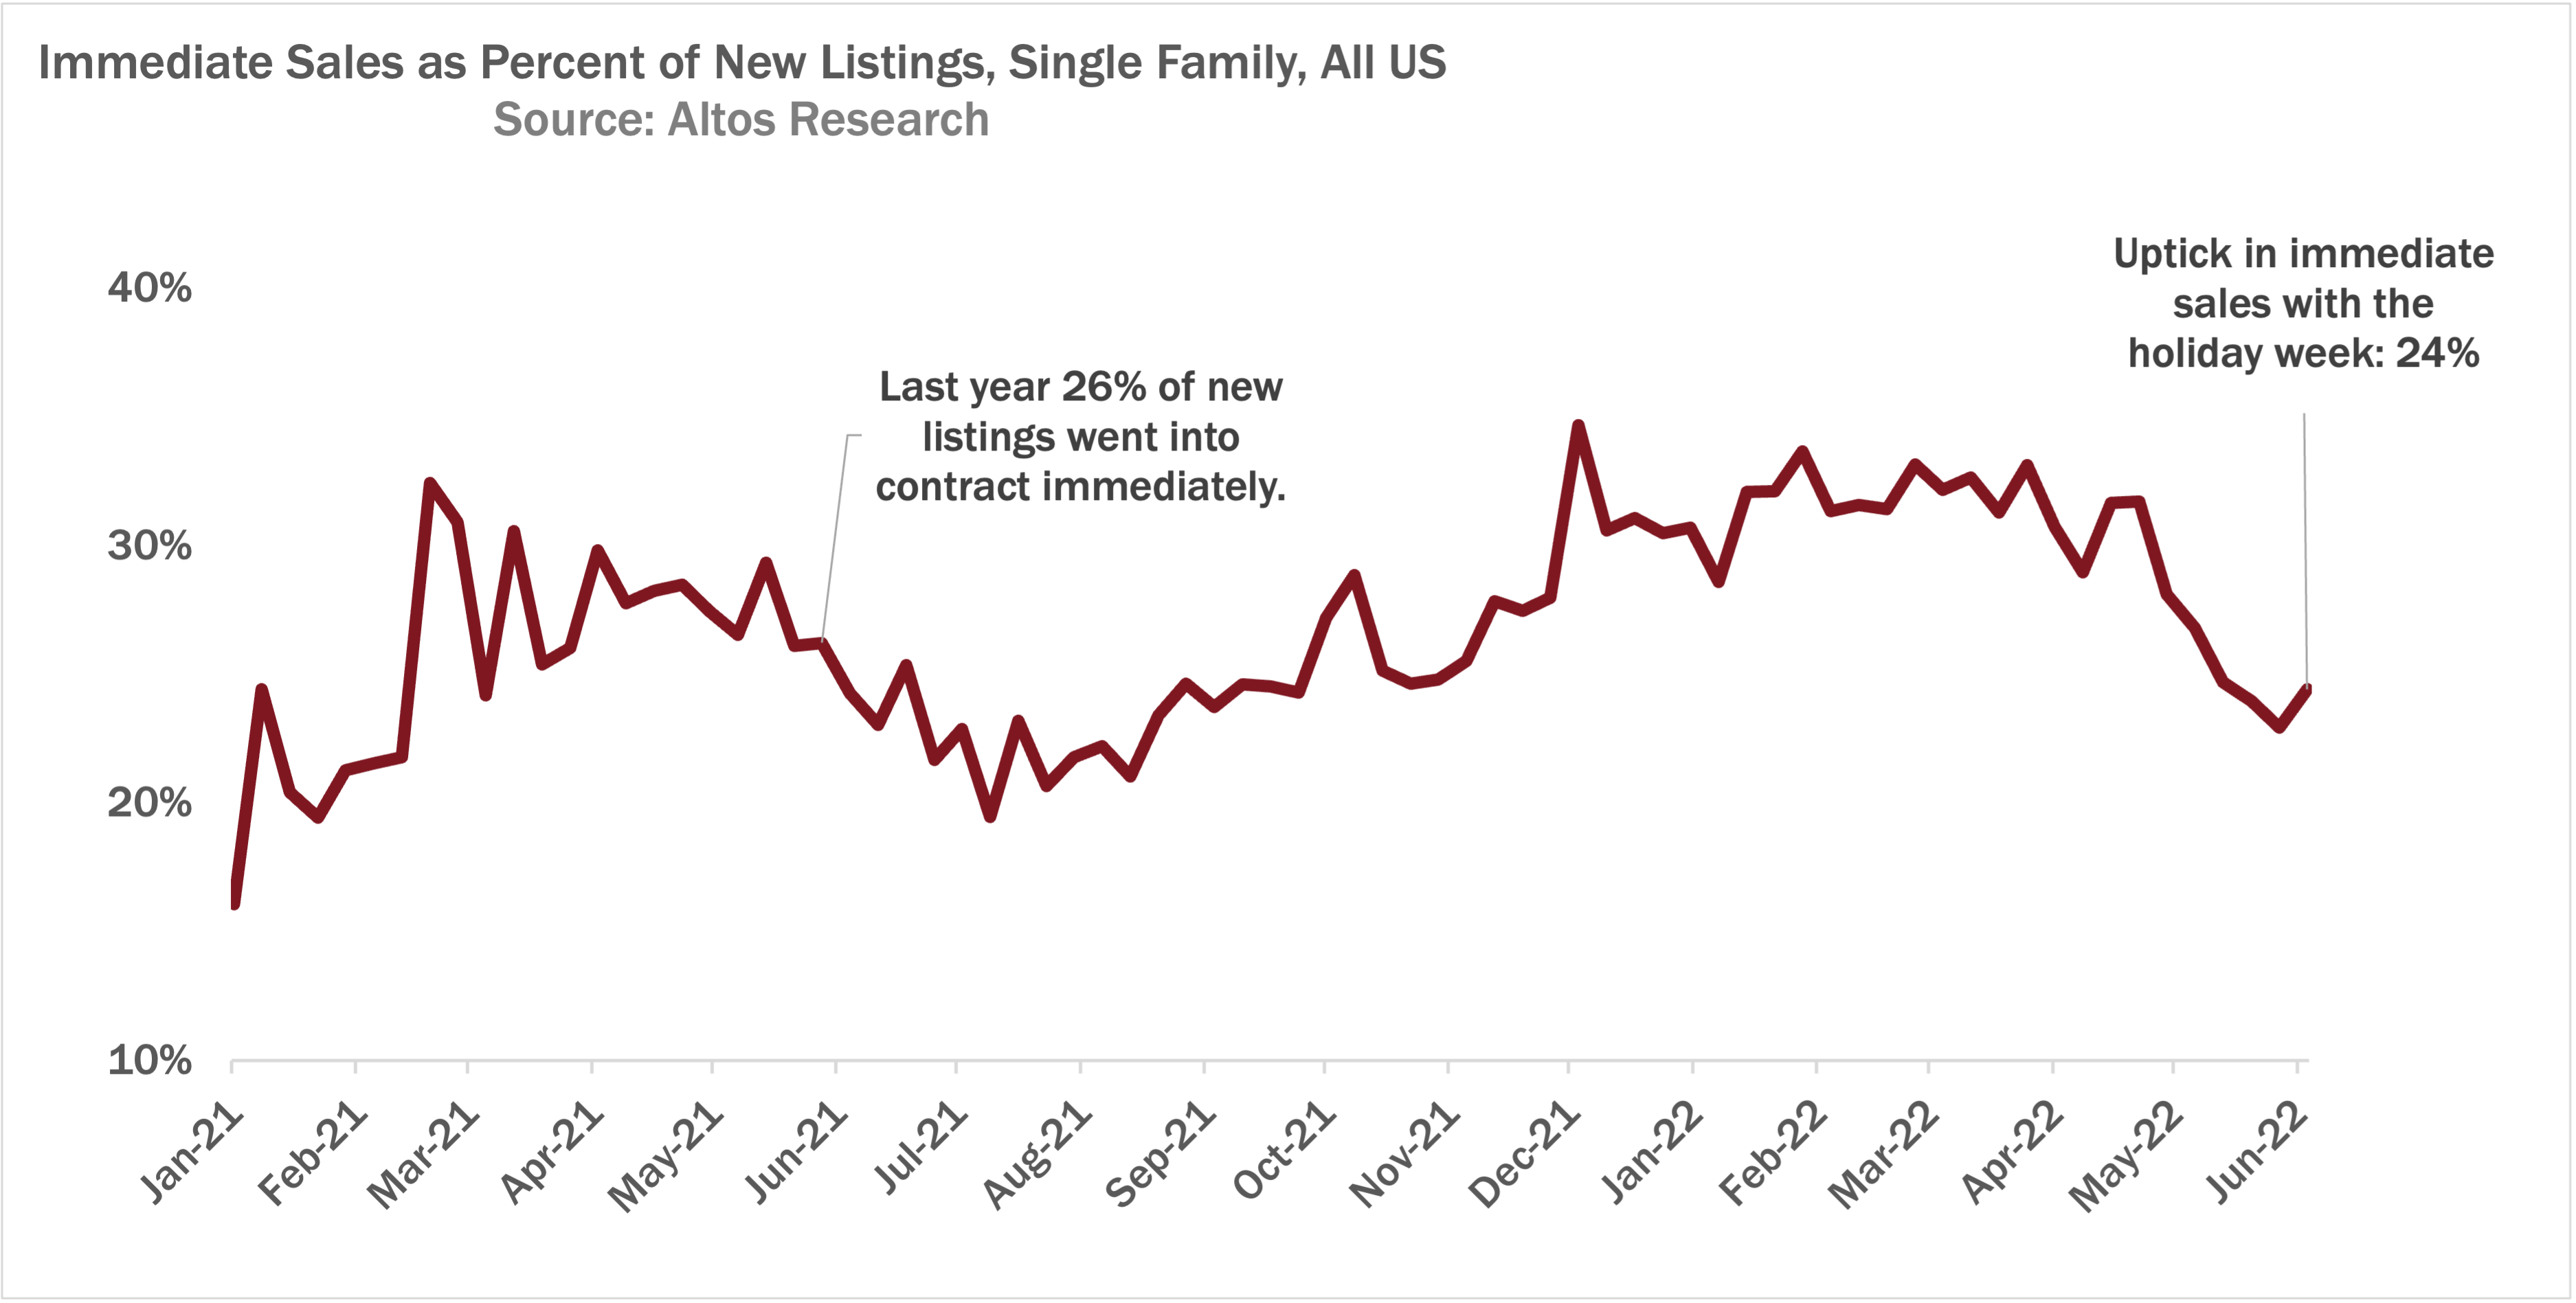
As a percentage, immediate sales ticked up this week. We’d had 6 weeks in a row of fewer immediate sales. This week because there were fewer new listings over all, the percentage immediate ticked up.
I expect this percentage to resume its decline next week. Fewer bidding wars, more options for buyers. Still lots selling quickly. Immediate sales has really been the defining characteristic of this housing boom. And because there have been buyers looking for a long time, many are still jumping on their opportunity when they get it.
Prices
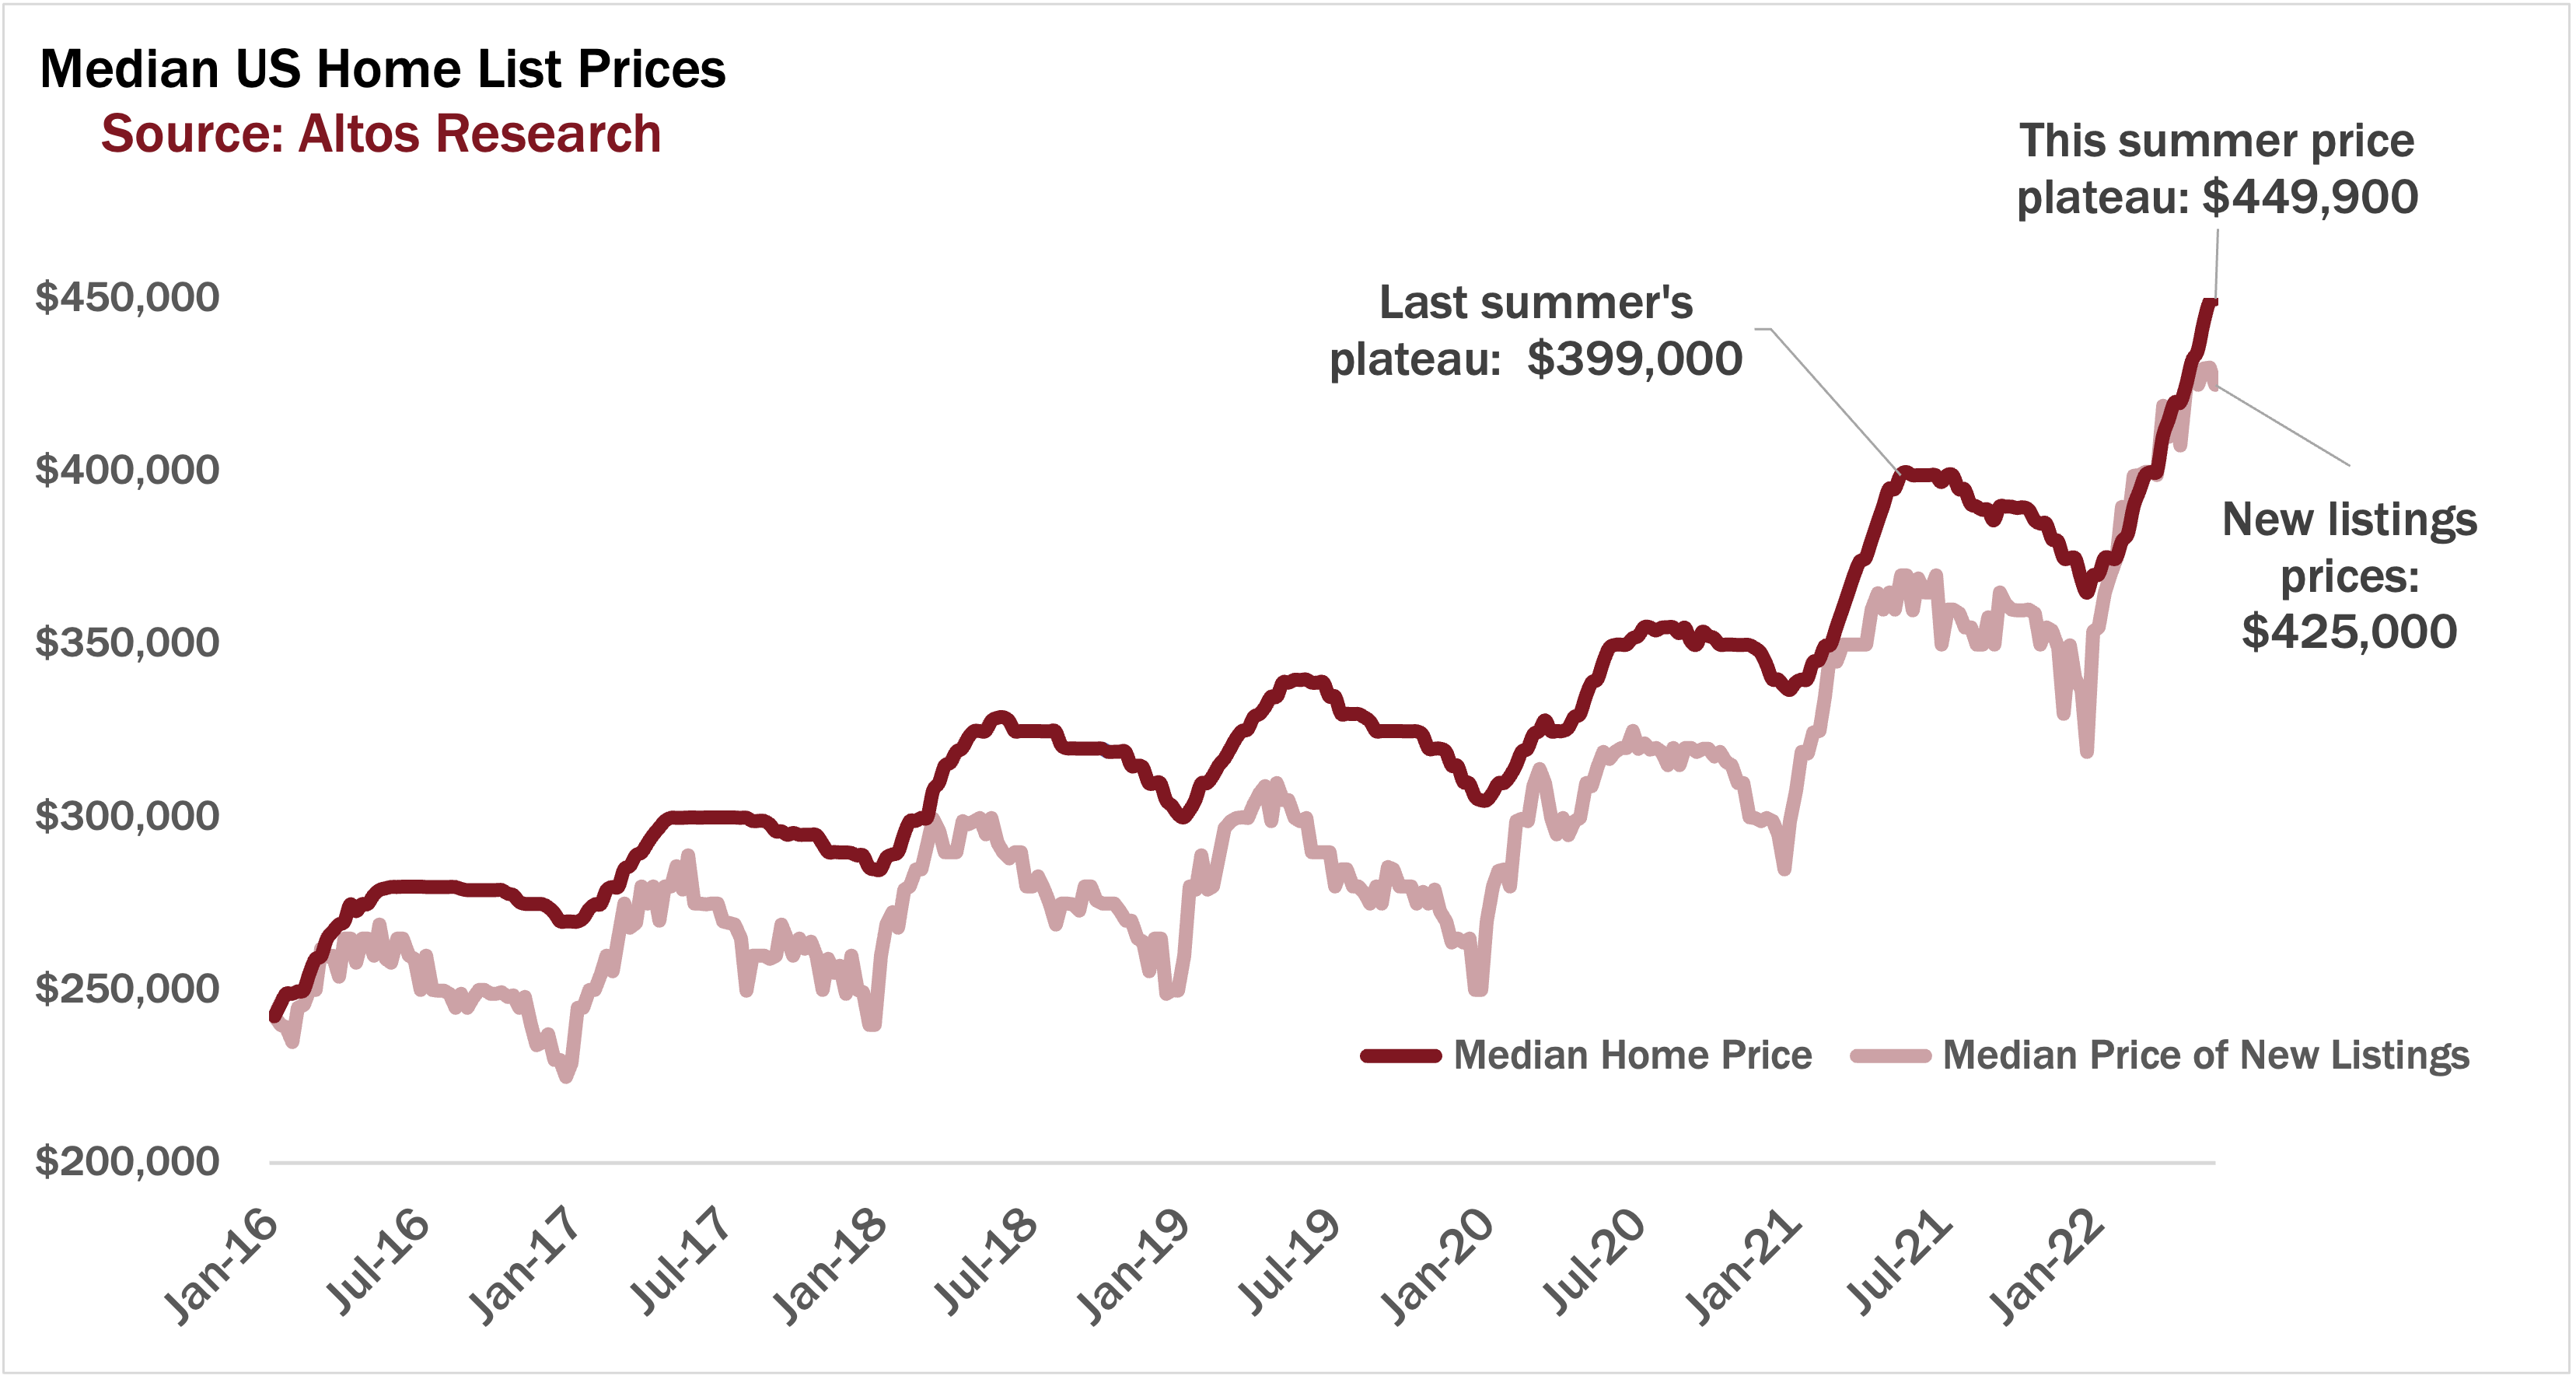
Let’s close this week with prices. The median price of single family homes in the US is $449,900 right now. That’s up just s smidge from last week and it really shows how the summer plateau clusters around the big numbers, in this case $450,000.
It’s a new record high for home prices. But I expect this is it. I don’t anticipate we’ll break above this this year. In fact, Some of the leading indicators we’ll discuss in the webinar next week point to 0 home price appreciation in 2023, so it could be two years before we break this record again. We’ll see.
The median price of the new listings is down this week to $425,000. You’ll see this summer that the light red line plateaus lower than the dark red. This is healthy. The light red line has been so strong all year, you can see how it spiked up at the right end of the chart. It was telling us very early to expect the 10-12% home price gains that we’re now measuring.
It’s a little weird to be talking about record home prices and rising price cuts at the same time. It’s a very scary time to be in this market. Agents when you’re counseling your sellers this is one way to communicate with them. Yes, the market is still strong, price reductions are fewer than normal, but it’s changing quickly, so let’s do this right, set the proper price so we don’t get behind this curve. If you need to have these conversations with clients, go to AltosResearch.com and sign up now so you can have your data in the hands of your potential sellers and buyers today.