
Mike Simonsen
Mike Simonsen is the founder and president of real estate analytics firm Altos Research, which has provided national and local real estate data to financial institutions, real estate professionals, and investors across the country for more than 15 years. An expert trendspotter, Mike uses Altos data to identify market shifts months before they hit the headlines.
Available inventory keeps growing. The increase this week in unsold homes available on the market was the biggest in many years. If you recall the video last week we actually forecasted a pretty big week of new inventory. It it turned out to be bigger than I expected, the model expected 27,000 growth and we ended the week with 31,000 more homes available on the market than the previous week.
Is this market pulling more sellers trying to get out before it all crashes? Or is this just a drop off in demand? Probably both. In some ways, you could say the cure for low supply is more supply. Ironically, the thing that seems to incentivize sellers to sell is watching a lot of other sellers on the market.
A year ago I hoped that maybe the cure for our record low supply would be sellers seeing the opportunity with less competition. But it looks like sellers need to see the opportunity vanishing before they decide to list. Fascinating phenomenon. But mostly it looks like this is the demand side backing off allowing the available inventory to climb up from the record lows we’ve had for two years. There aren’t huge waves of new sellers hitting the market. Just that buyers are less maniacal.
Every week Altos Research tracks every home for sale in the country. We analyze all the pricing, supply and demand, and all the changes in that data and we make it available to you before you see it in the traditional channels. If you aren’t using Altos market reports with your clients, your buyers and sellers, now might be the time to step up. Go to AltosResearch.com and book a free consult with our team. Because everyone is worried about what’s happening right now. They need you to help them see clearly.
I’m Mike Simonsen, I’m the CEO of Altos Research. Here’s what we’re looking at for the week of July 4 2022. Happy Independence Day.
Be sure to register for the webinar this month.
Unsold Inventory
With 475,000 single family homes on the market this week we have our highest levels of unsold inventory in a year and a half. Inventory grew by 7% this week alone. Inventory is rising quickly on a percentage and absolute basis. It’s rising faster than normal for this time of year - inventory usually rises in June, so this is good, but it’s rising notably faster than normal Junes. July 4th week usually marks the turn for the summer plateau of homes on the market.
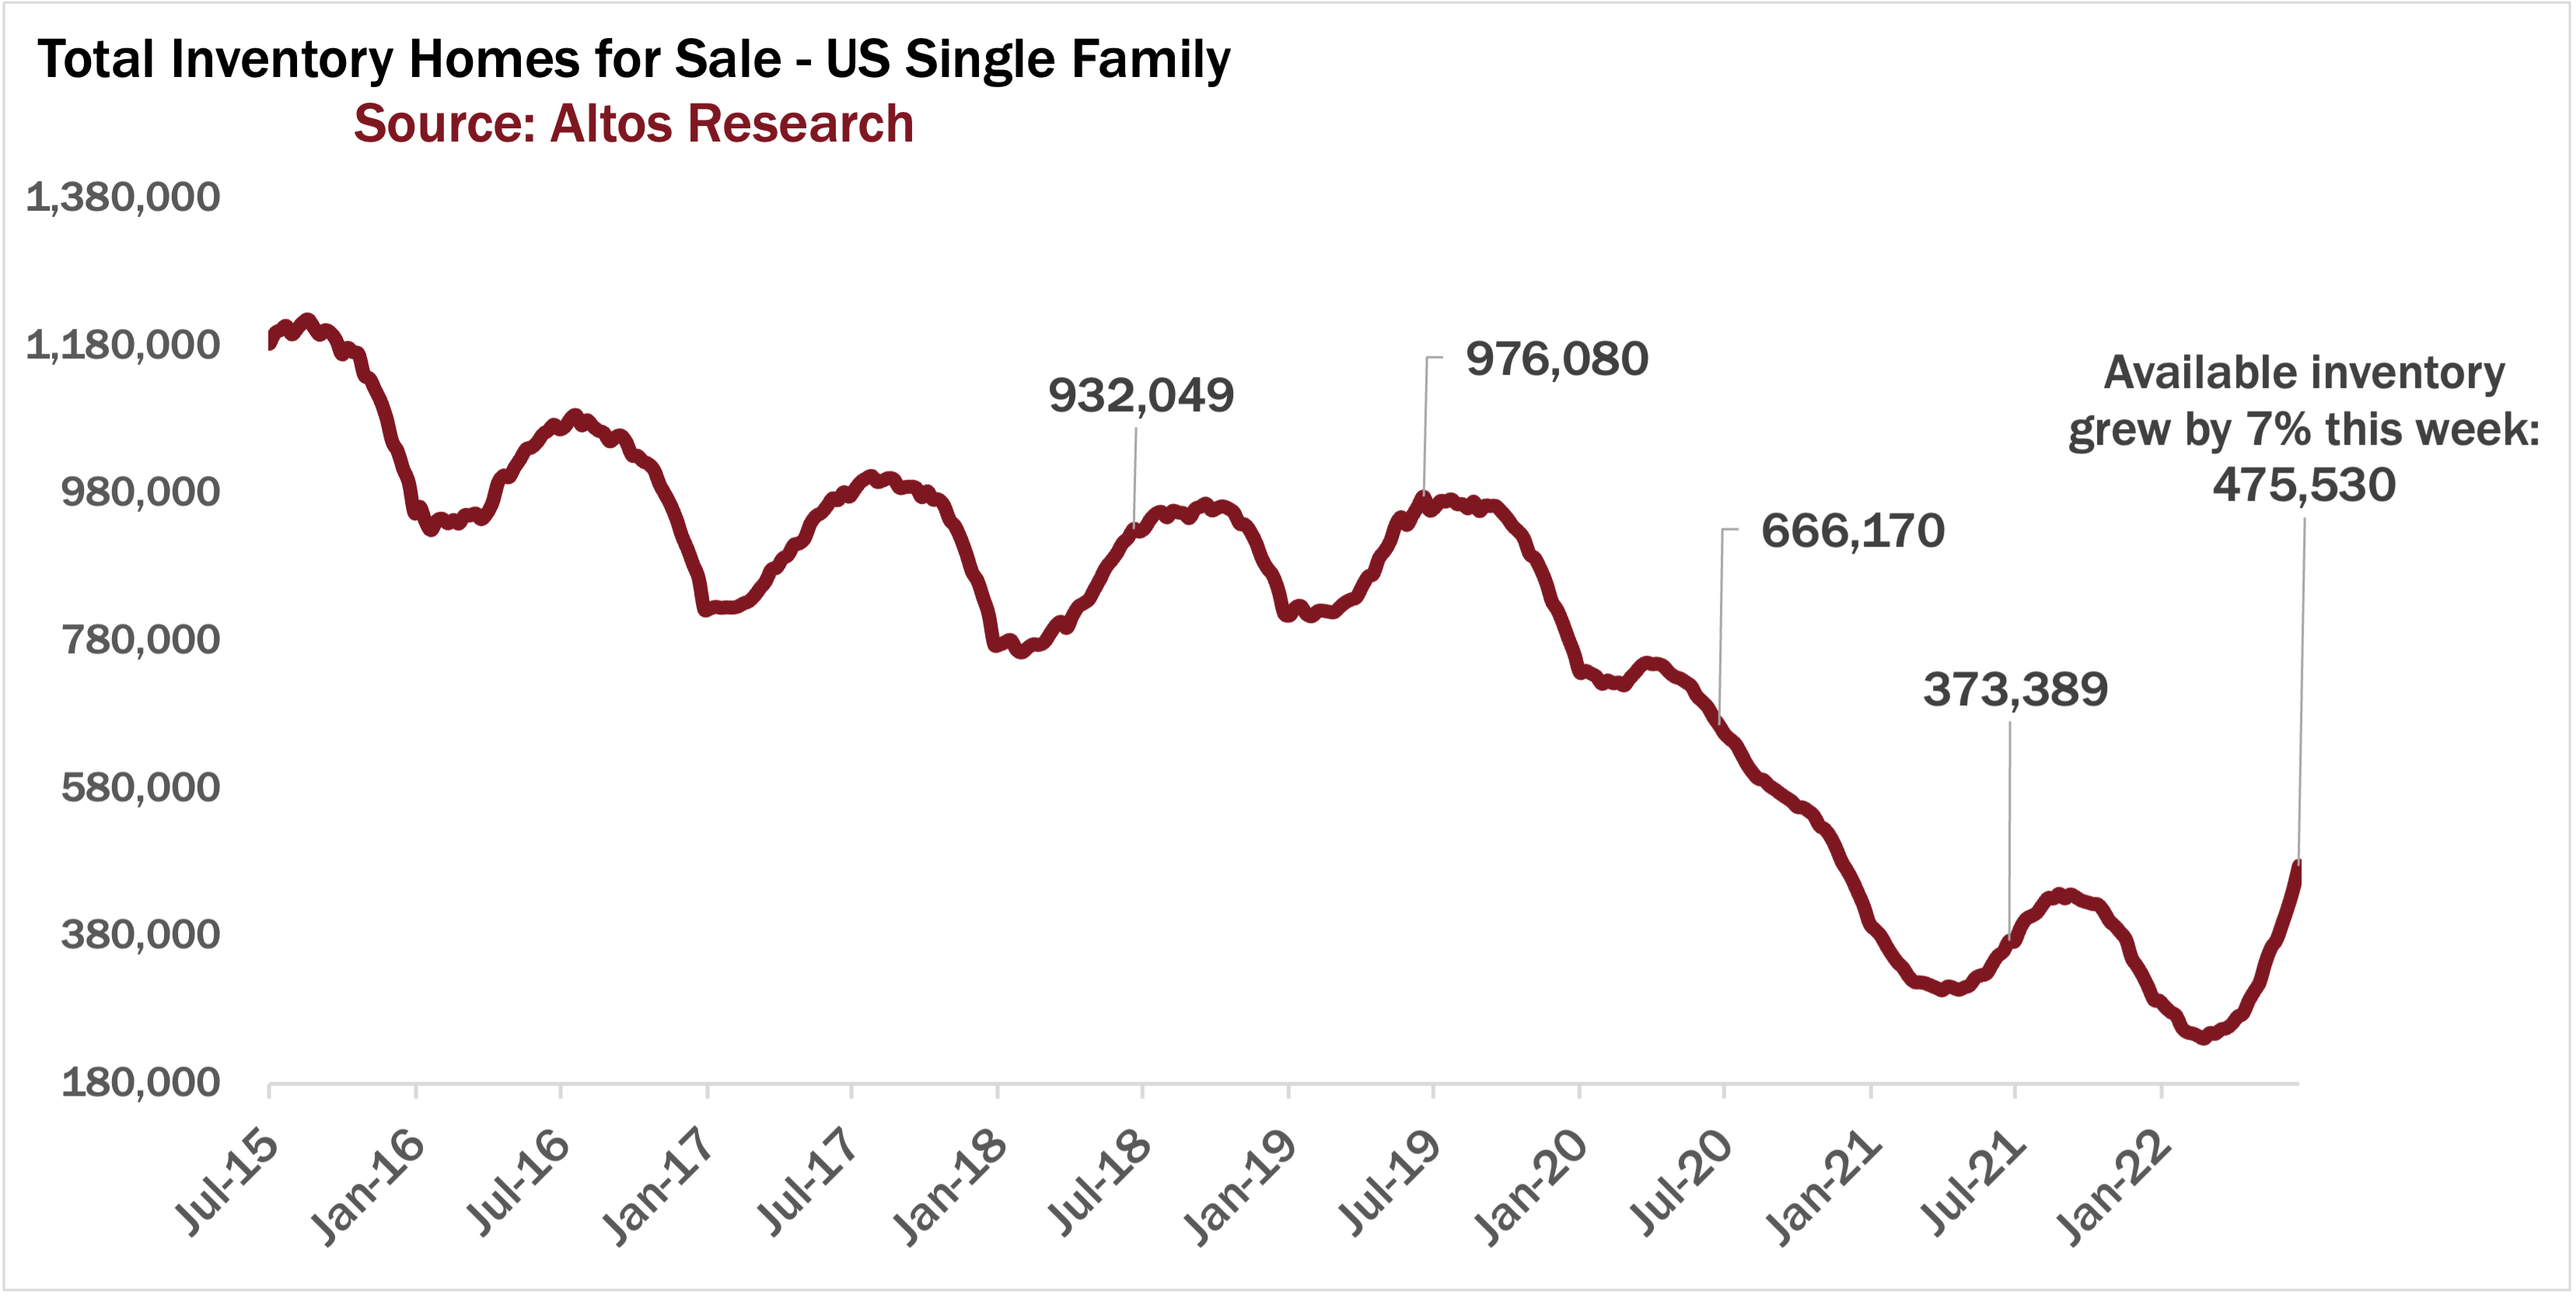
You can see each year has the summer plateau. By July 1 most homes are on the market, inventory will climb a bit through the late summer and then decline for the fall. This year, at the far right side of the chart, the slope is still pointing up sharply. Normally Inventory usually will gradually rise through the late the summer. This year we haven’t obviously turned the corner yet. In fact most years the July 4th holiday week actually has a decrease in available inventory. This year we’re expecting simply slower growth but we’ll see if the pace slows or if we inventory keeps shooting up. A signal to watch.
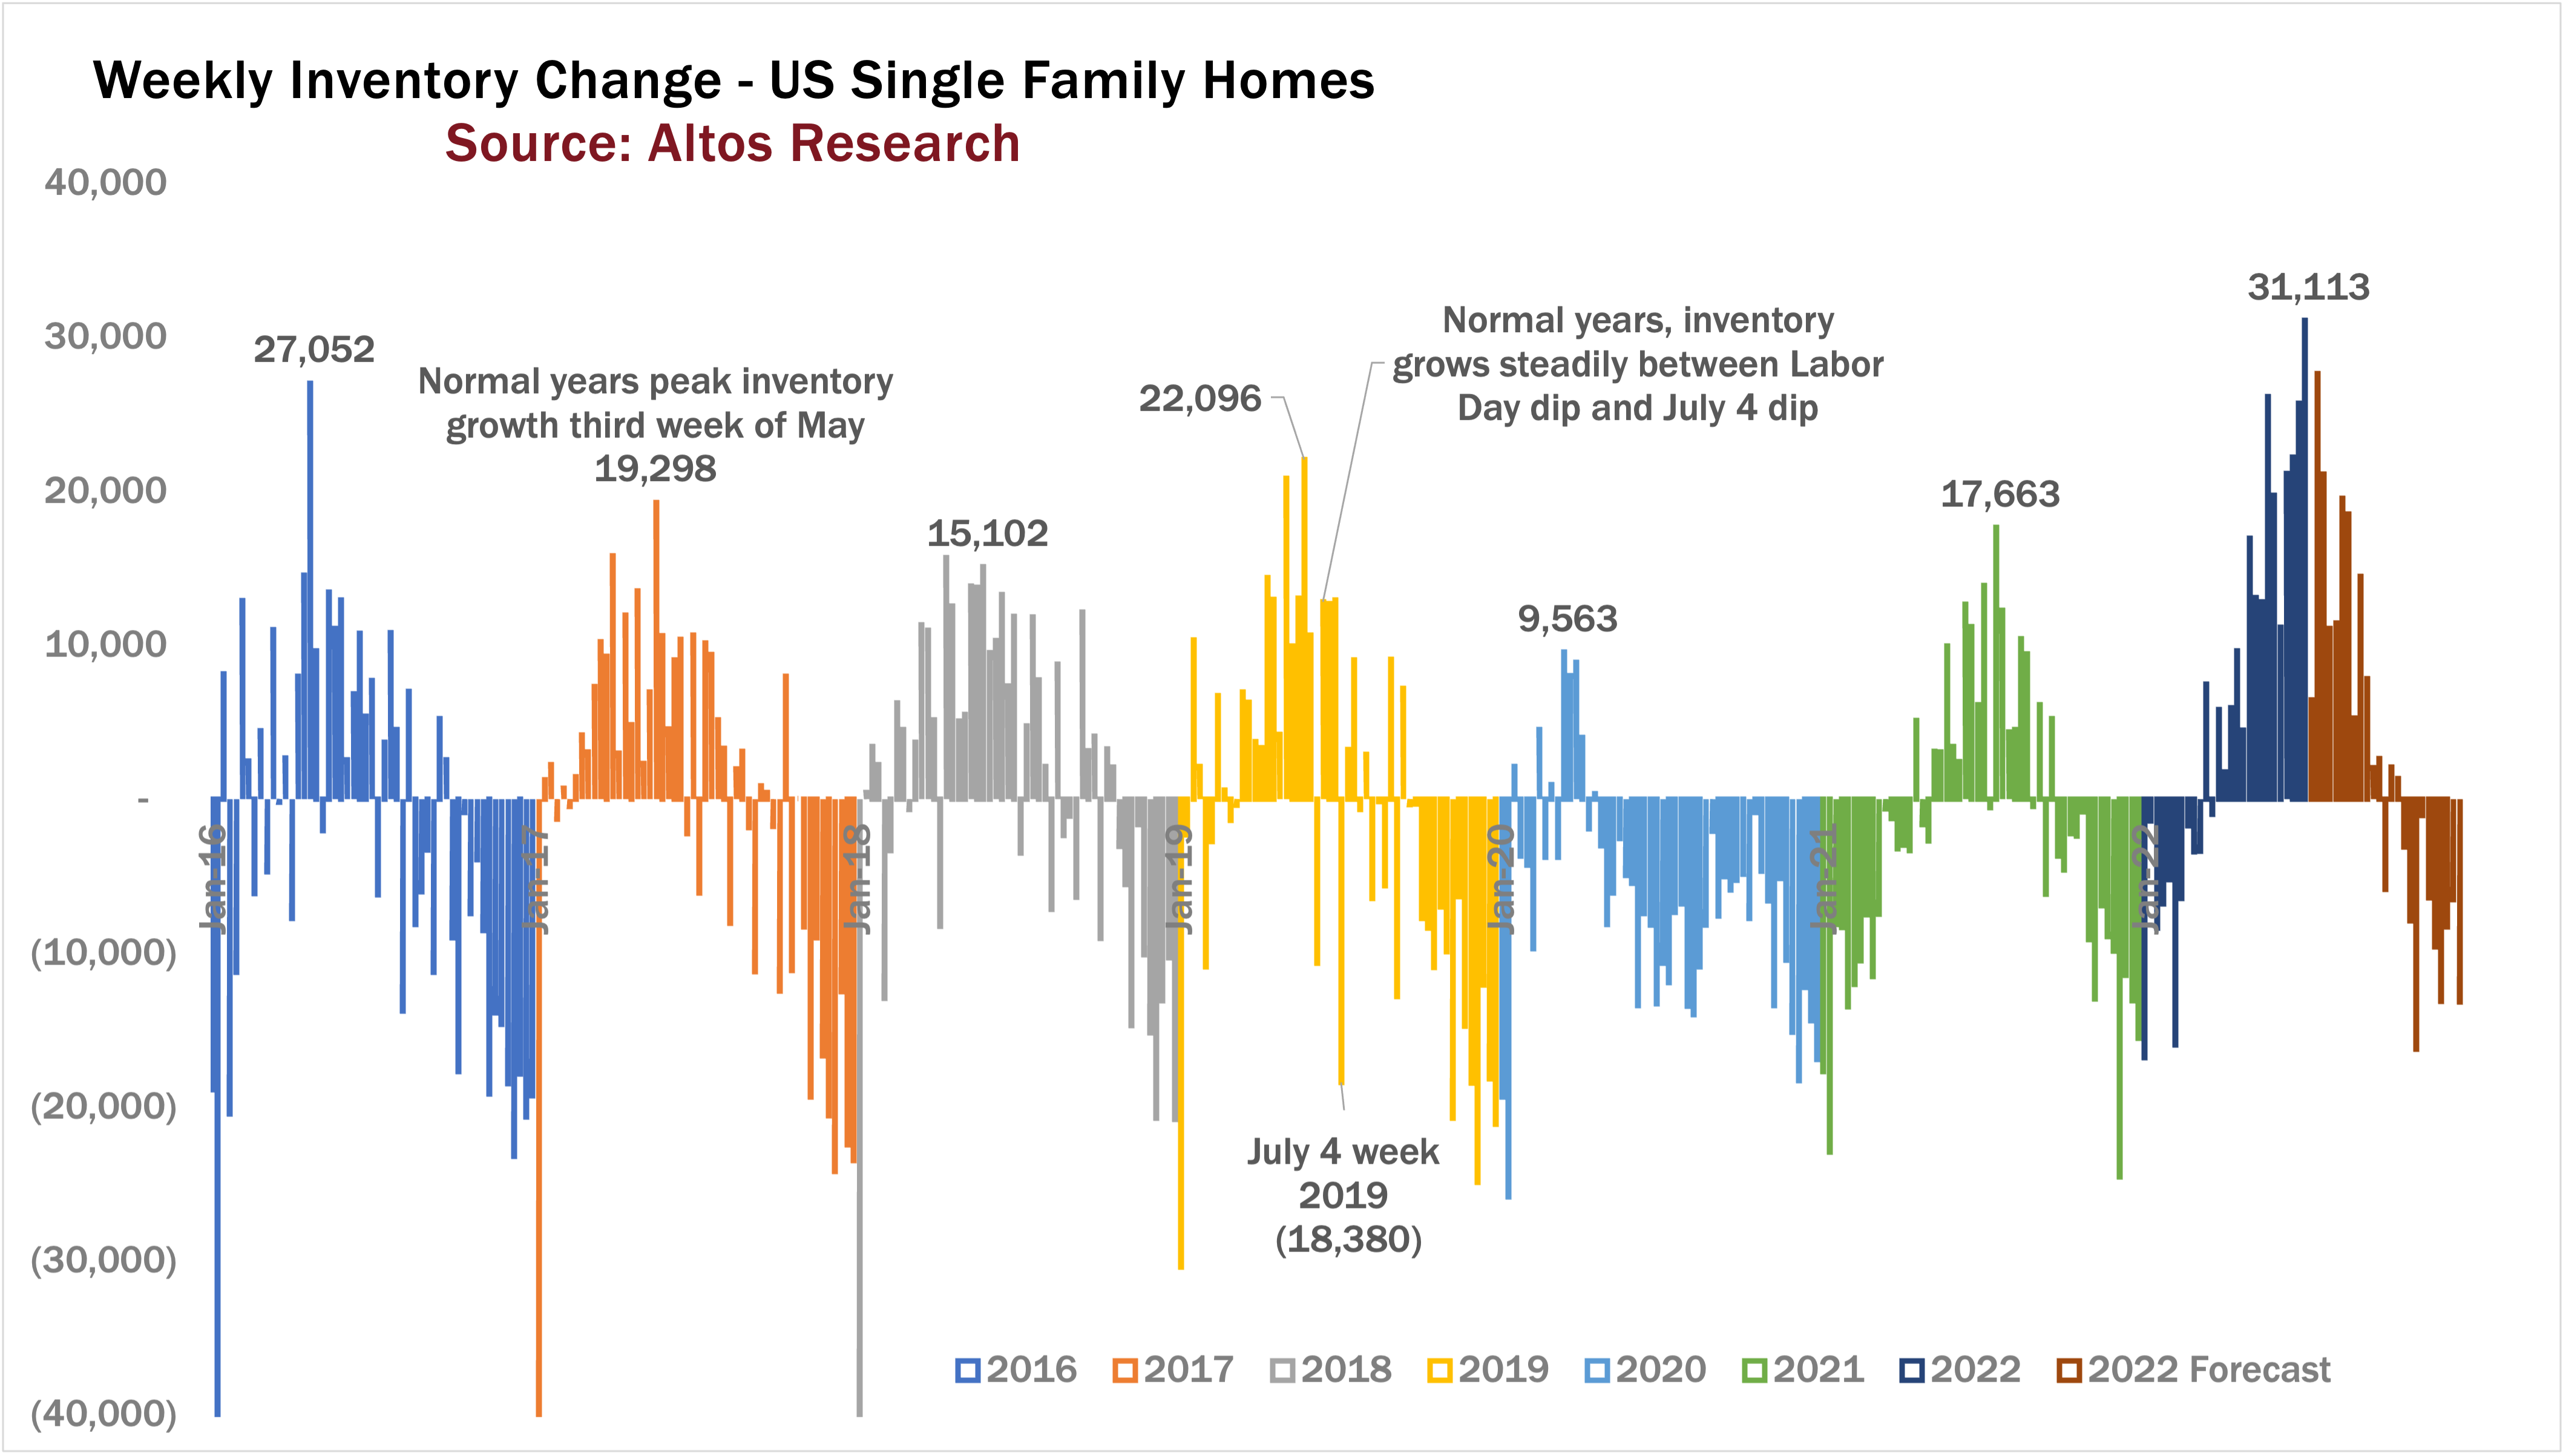
Here you can see the weekly change in inventory over the last bunch of years. Each bar above the line is a week when inventory rose, below the line is a week when inventory fell. This week available inventory of unsold single family homes grew by 31,000. You can see that’s the biggest week anywhere in the last 7 years on this chart so not just percentage levels, but absolute levels too.
This coming holiday week should see that dip, or at least slow the growth. There is lots more inventory growth to go for the rest of the summer. One signal I’ll be watching for is whether there are any weeks that beat this 31,000 number. That would be quite unusual. And it’d be very telling.
The brown section at the far right end of this chart is how that looks. This is the week by week forecast for the rest of the year. As of right now, you can see that we expect last week that 31,000 gain, to be the peak of the new listings volume. Normally that peak is the third week of May. And if you recall 6 weeks ago, we hit a peak of 26,000. This week blew past that number, and that’s very telling to me. As of right now we expect gradually lower peaks for the rest of the summer. But here’s one place we’ll keep our eyes on. Does inventory growth keep breaking through the normal seasonality?
Median Price of Single Family Homes
Meanwhile the median price of single family homes in the US is bouncing around this $455,000 level each week. Prices actually ticked up a tiny fraction from last week. As we roll into the second half of the year, this is when home prices start easing back for the fall. That prices have held up so far is probably a sign of strength. We see inventory growing, but we actually see plenty of buyers too in much of the country.
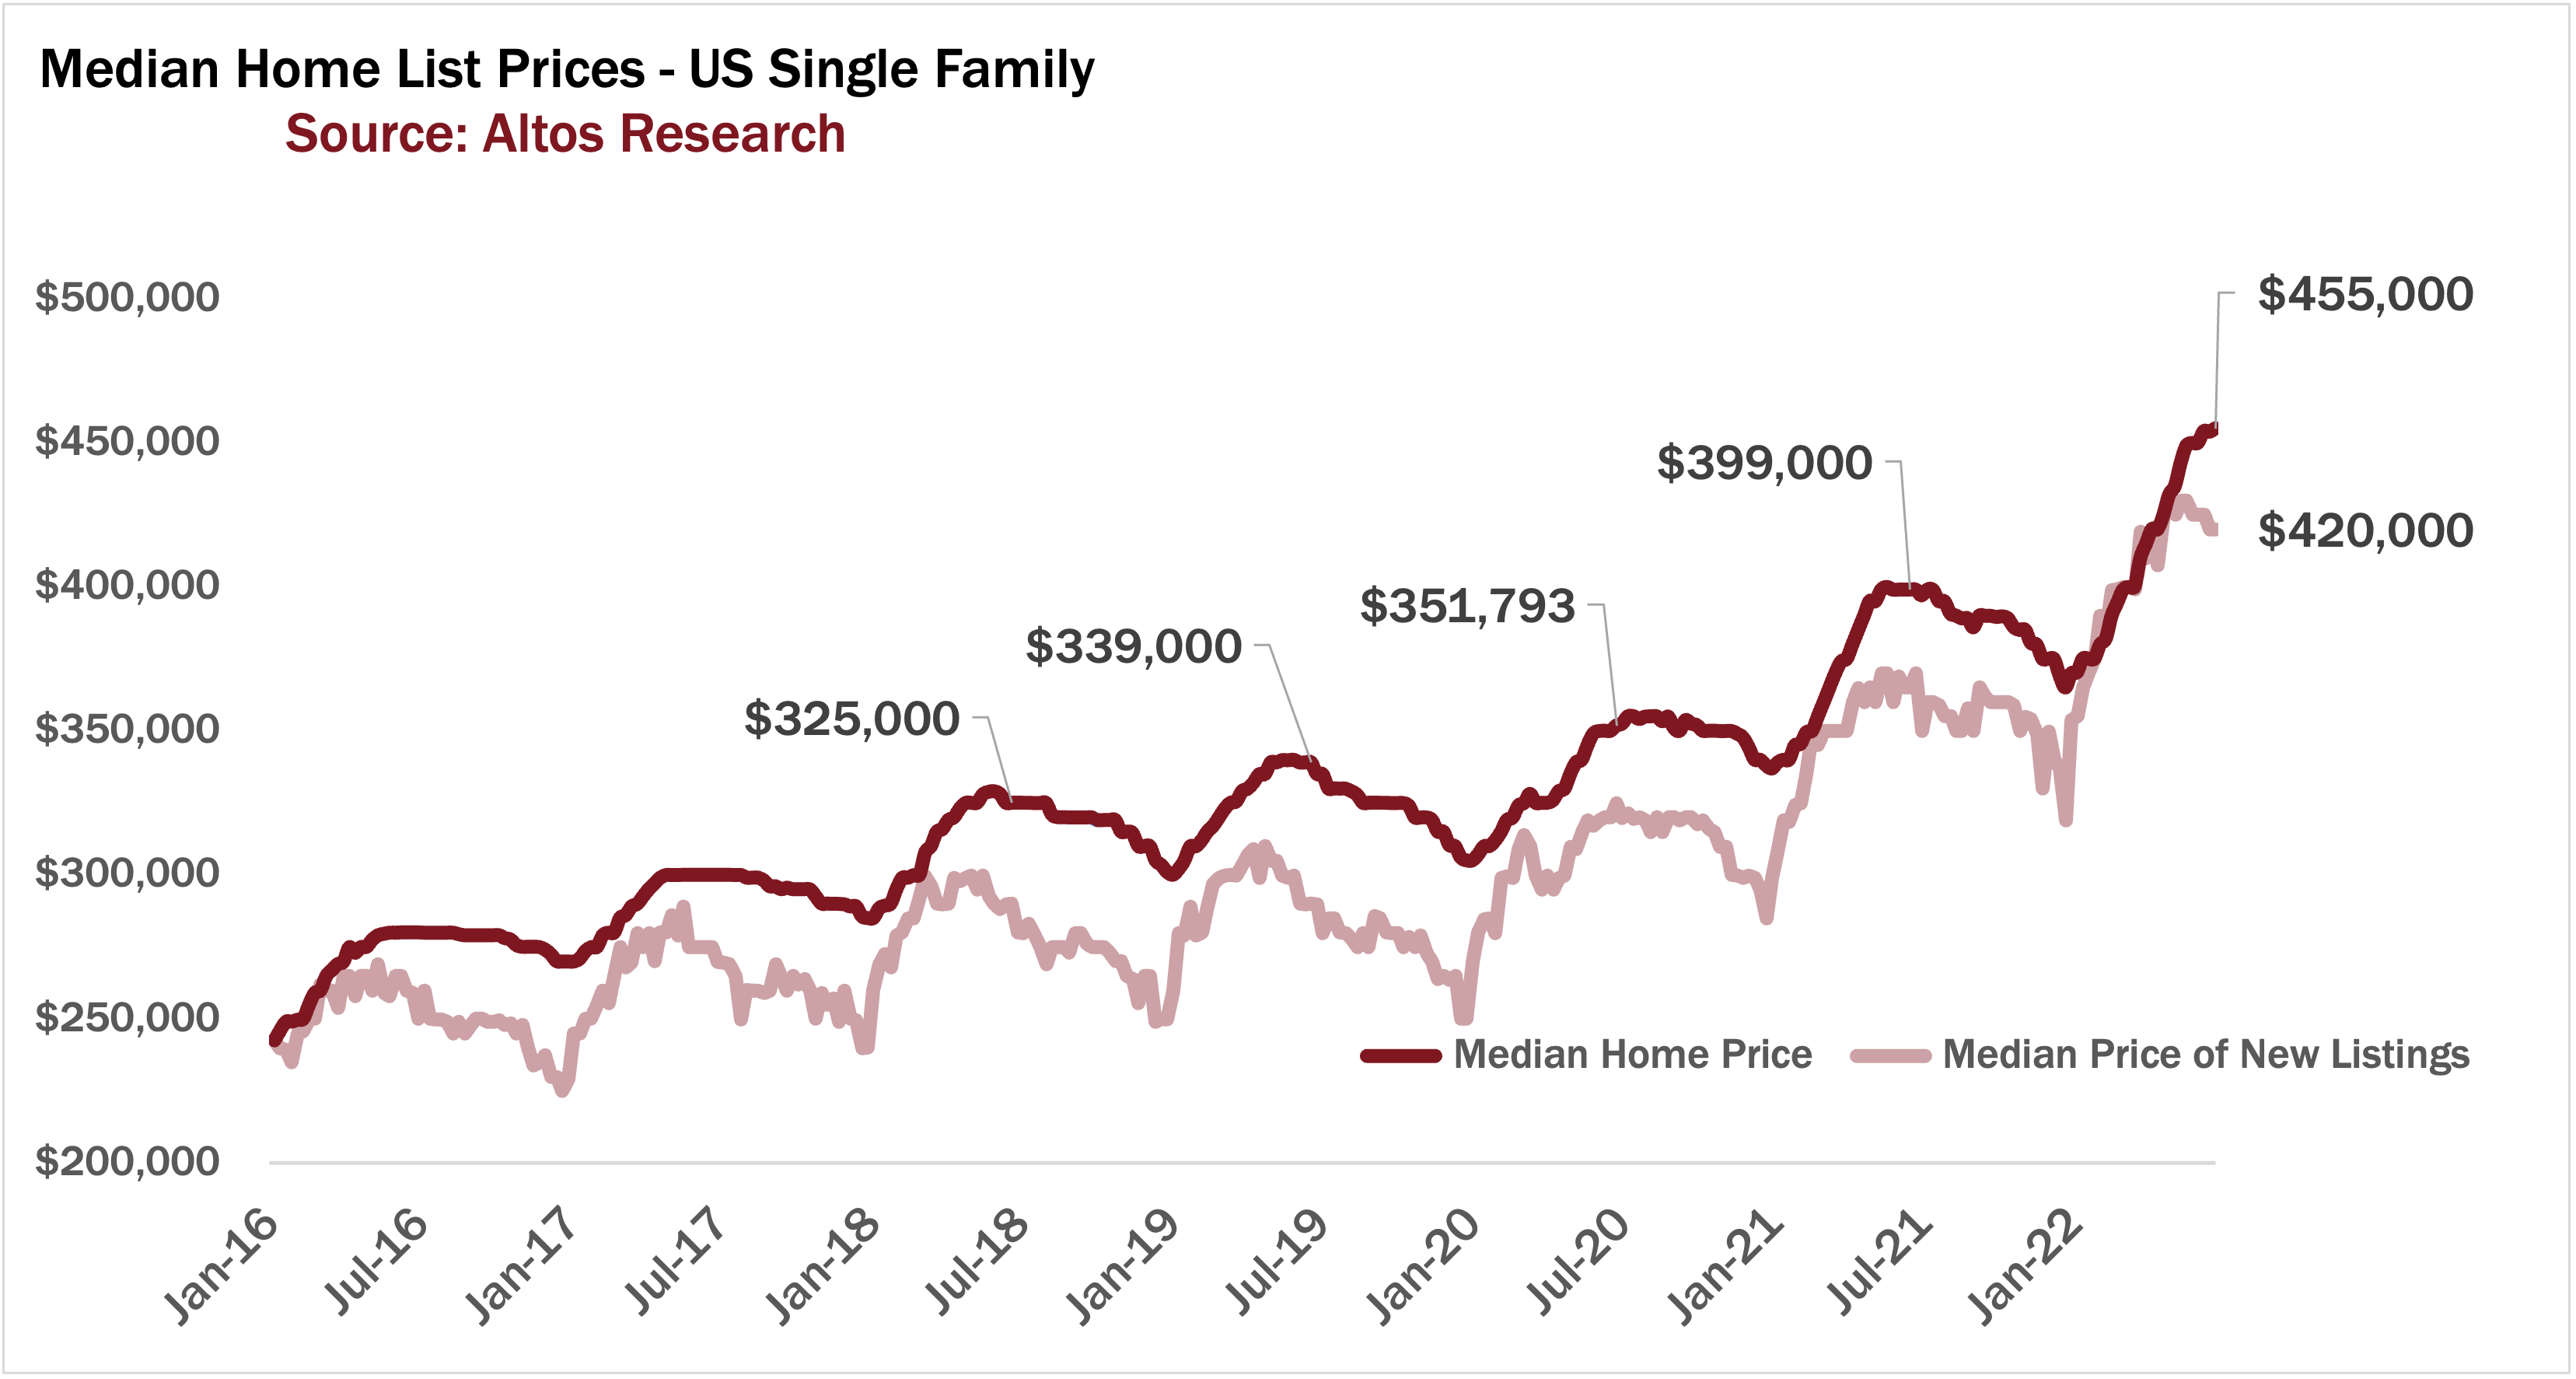
The median price of the newly listed cohort is also steady this week at $420,000. The price of new listings measure, the light red line here, is the leading indicator. Pricing was so strong earlier this year, and is only now easing back down a touch. This one of the signals that sellers aren’t that panicky yet. Enough homes are selling quickly enough that the latest sellers aren’t resorting to steep discounts. It’s fascinating watching a bifurcated market. Buyer are buying lots of homes. Even while they’re buyer fewer than they were. A slowing market that still has tight inventory and reasonable demand.
Immediate Sales
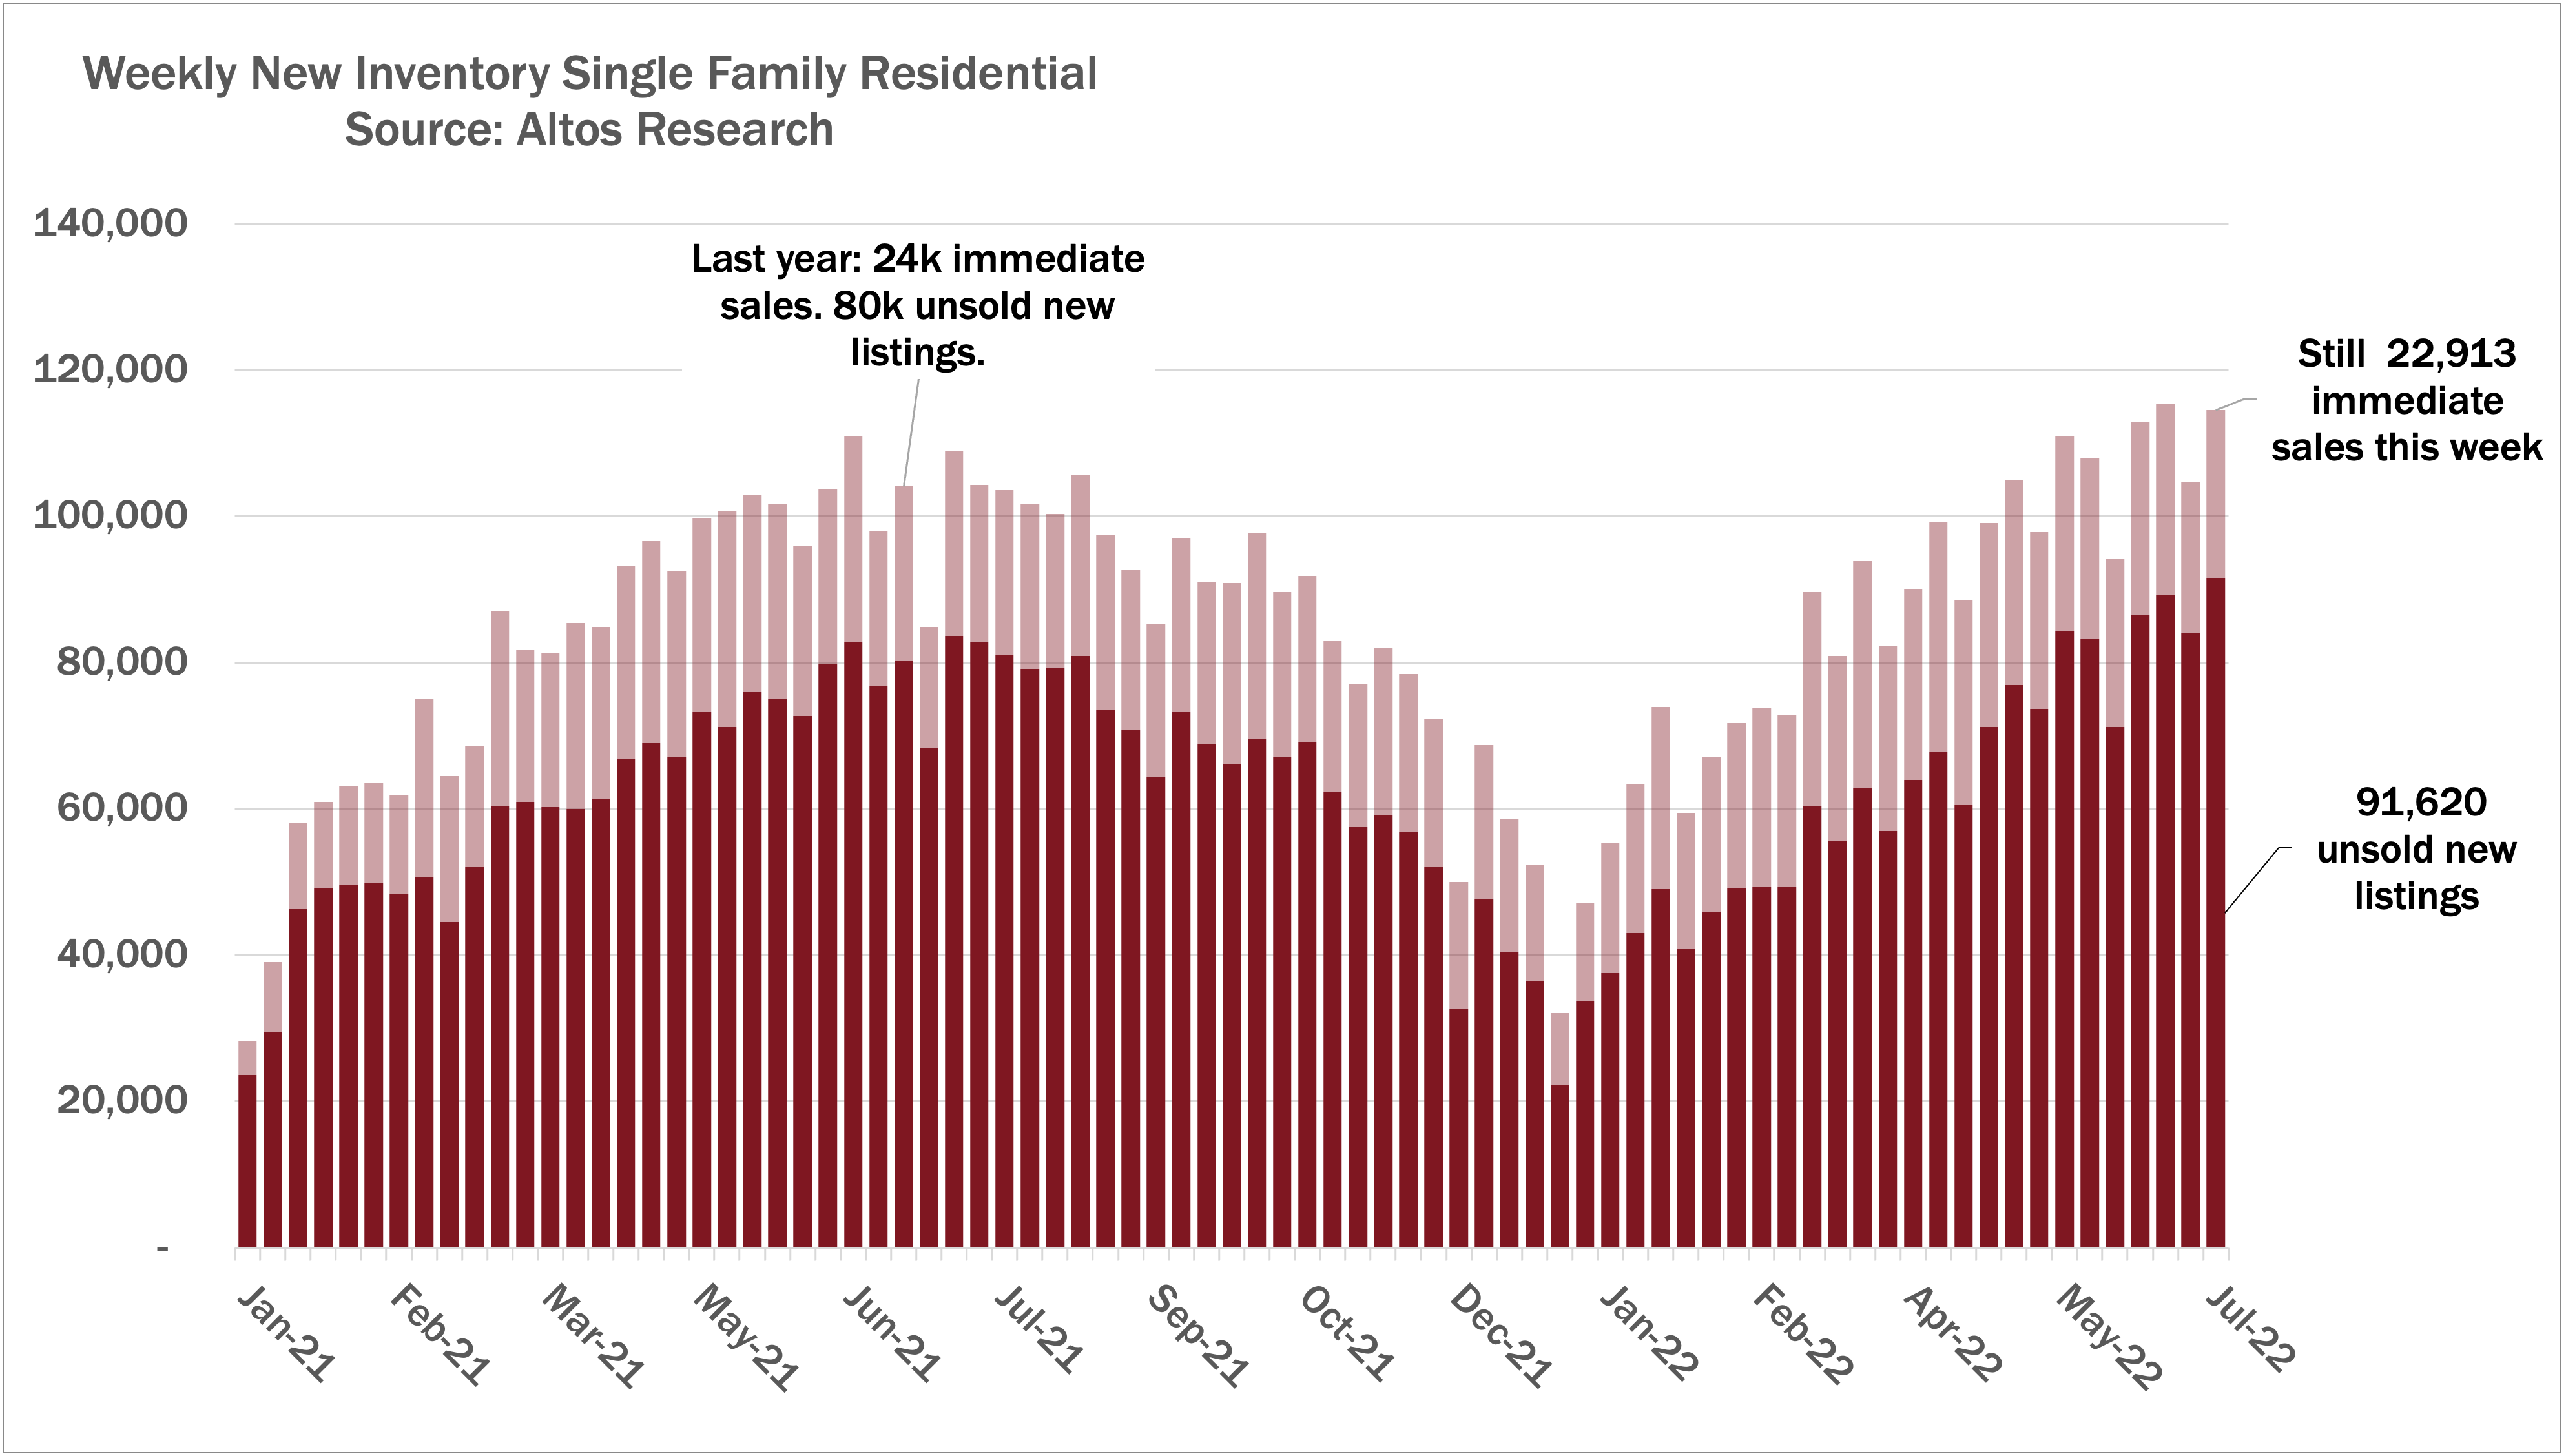
Speaking of our demand indicators, the pace of Immediate sales held steady this week, as inventory is climbing rapidly. Almost 23,000 immediate sales across the country this week. With 91,000 new listings that didn’t go into contract immediately. That’s more unsold new listings than we’ve seen in a couple years. 20% of new listings went into contract essentially immediately. That’s way fewer than earlier in the year, but actually still shows buyers buying.
On the other hand, that previously insatiable demand is obviously slowing each week. One characteristic of a really hot market is that even the junk homes sell. The ones which need a lot of work or have peculiar flaws. Or if they’re over priced. When the market turns, these are the ones that start to sit. If they sit too long, they take a price reduction to be more appealing. And, more homes took price cuts this week demonstrating the weakening in buyer demand.
Price Reductions
This is what I mean by bifurcated market. A big chunk of homes were over priced. They were relying on people moving from California or New York to support the high asking prices. Those buyers have slowed. So price cuts are increasing rapidly. Just over 30% of the homes on the market have reduced their asking price recently. This is a totally normal share of the market, but it’s the most we’ve seen since 2019. It’s also rising rapidly each week. Much faster than we’ve seen in many years. Surprised sellers are learning that it’s not March anymore.
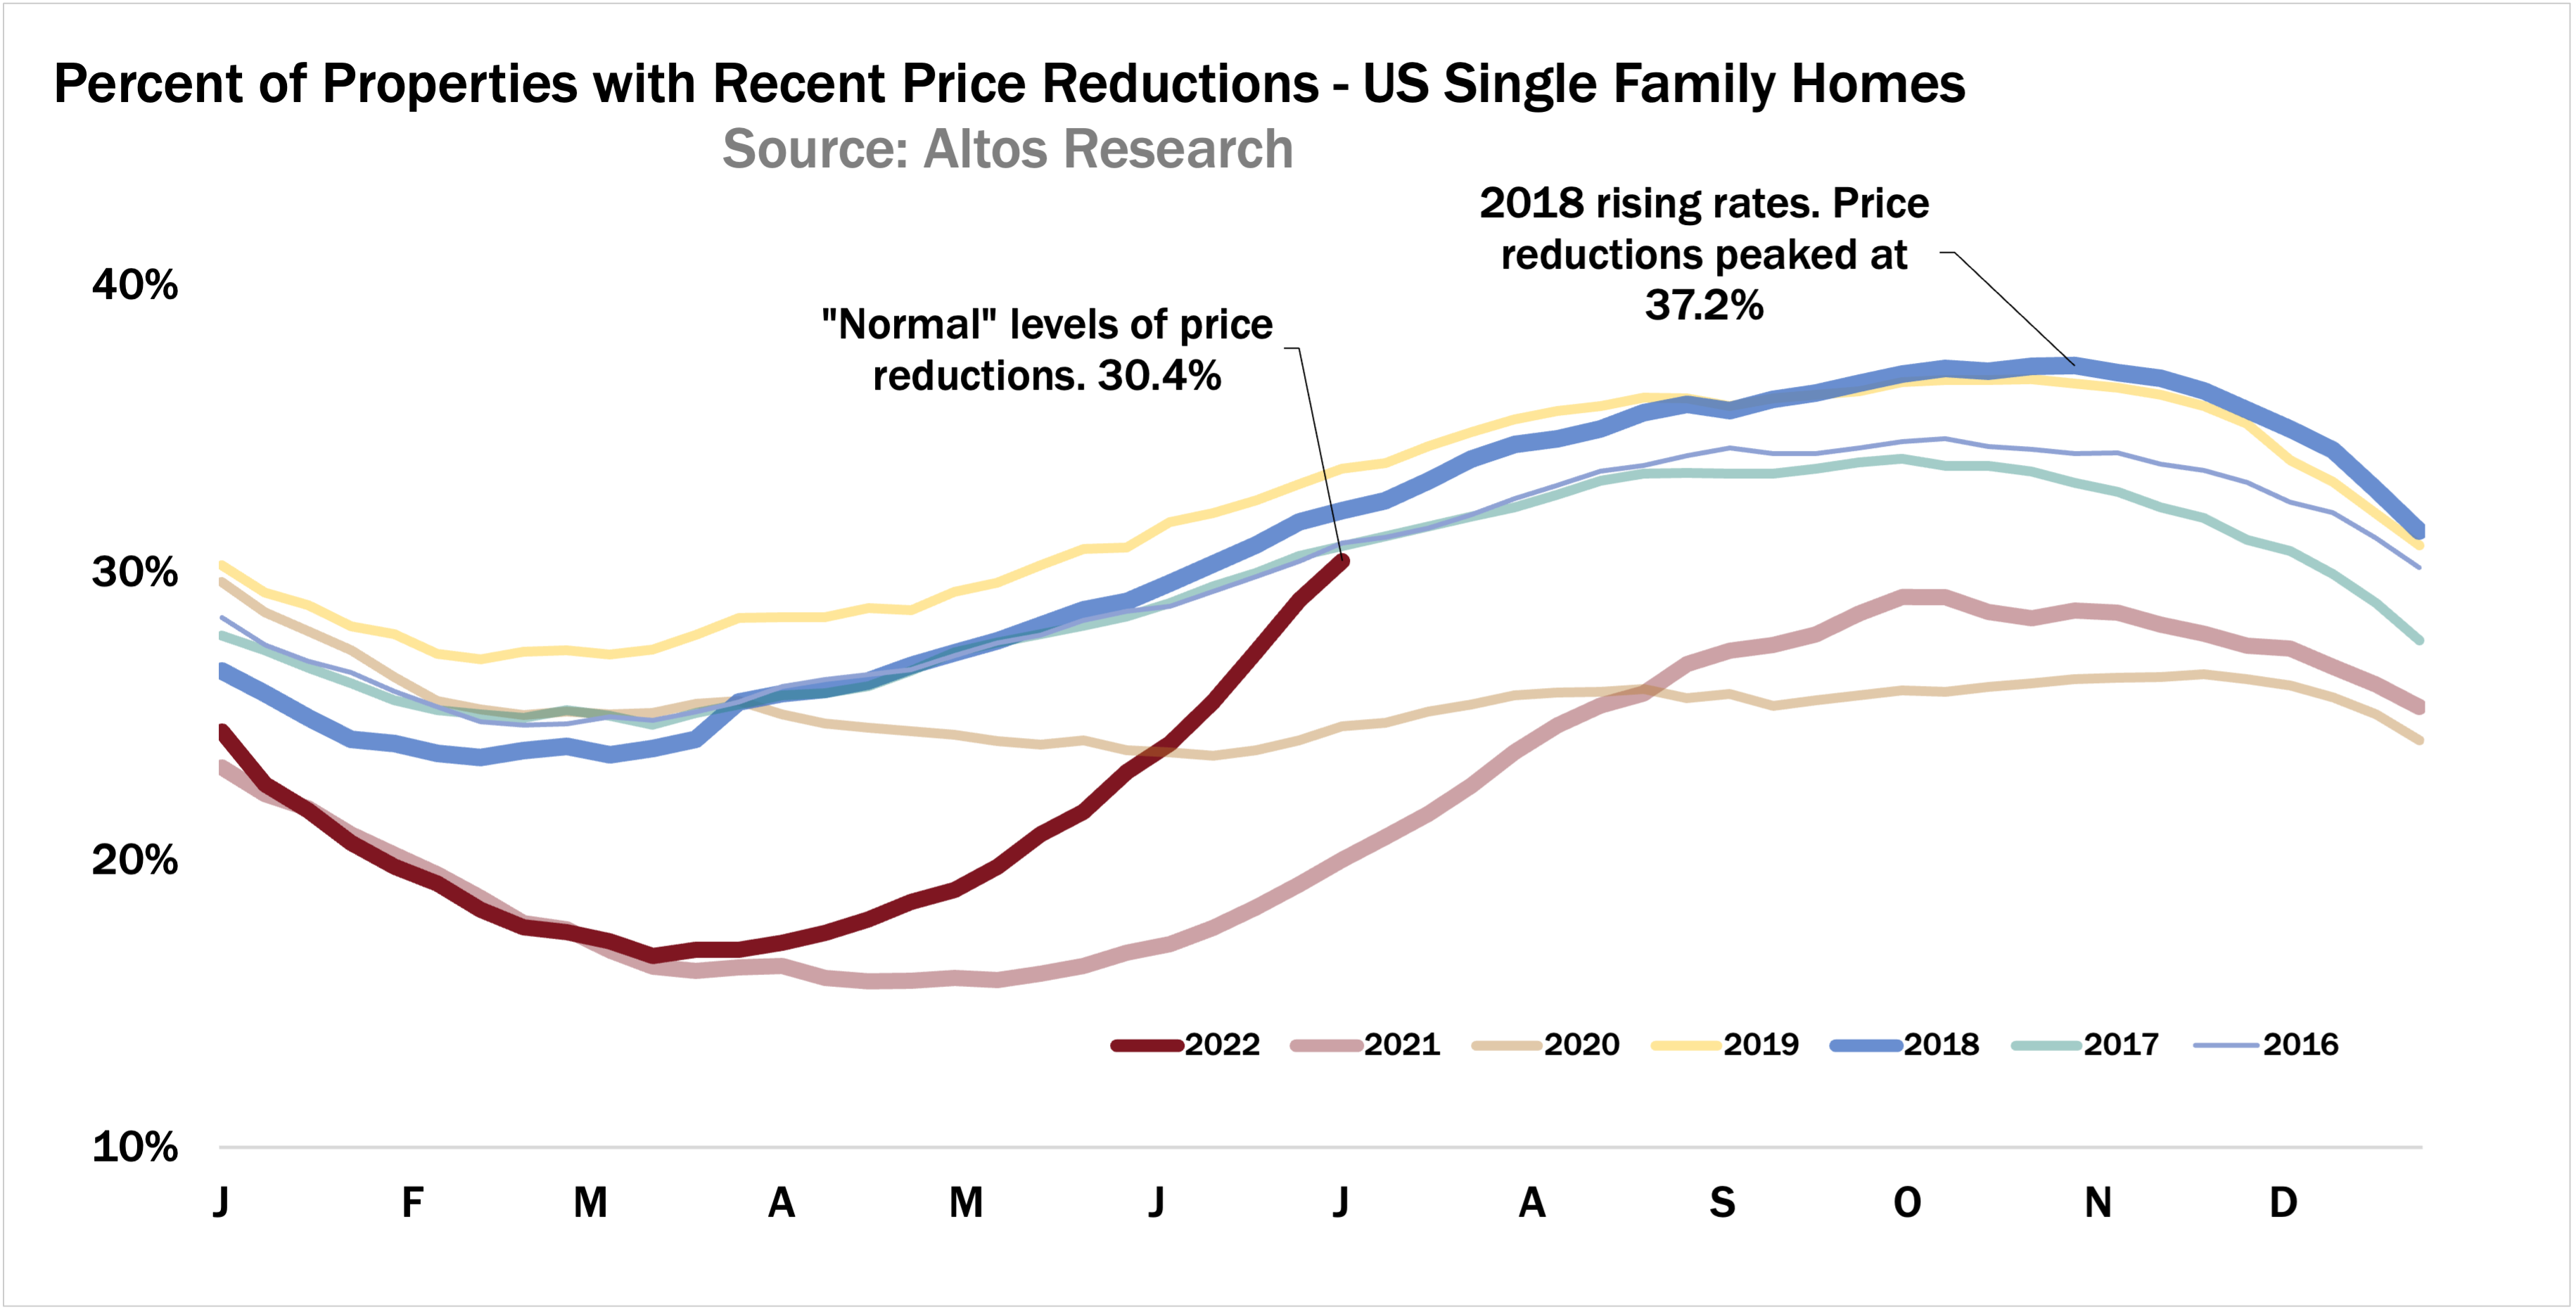
In the coming weeks we’re going to keep an eye on the slope of this curve. The steep upslope we’ve been on shows how quickly the market changed. That’s the dark red line here. The levels of price reductions are just like normal for this time of year. Of course, normally by July the slope of the price reductions curve starts to flatten. It has been so steep with so many new price cuts each week you can see how quickly we returned to normal from record lows. Took only about 12 weeks. I expect the country to get to about 40% with price reductions by September before resetting for the holidays and next year. Steeper than that implies demand is continuing to drop. Shallower than that implies the market is finding some balance. So lets keep watching this curve.
Agents these are the challenges your buyers and sellers face. When you’re counseling your buyer and sellers they need this data to help them make decisions. Yes, the market is still surprisingly strong for the homes that are priced properly. Still almost 20% went into contract immediately this week. But price reductions are climbing so quickly, the ones that don’t price right are going to have even tougher conditions later in the year. If you need to have these conversations with clients, go to AltosResearch.com and sign up now so you can have your data in the hands of your potential sellers and buyers today.