
Mike Simonsen
Mike Simonsen is the founder and president of real estate analytics firm Altos Research, which has provided national and local real estate data to financial institutions, real estate professionals, and investors across the country for more than 15 years. An expert trendspotter, Mike uses Altos data to identify market shifts months before they hit the headlines.
When it comes to relevant stats you should definitely keep an eye on as you're helping buyers and sellers with their strategy, price increases and price decreases should sit at the top of your list. Let's discuss how to interpret the two.
% Price Decreased
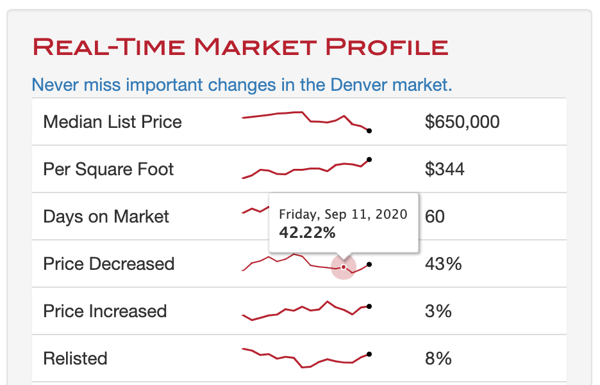
The percent of active listings that have received a price decrease is a measure of demand. In a normal market, we tend to see about 30-35% of sellers initially over-price their homes and eventually reduce the price to attract buyers. In some markets with more inventory, it can be common to see price reductions at 40%. Below 30% signals solid demand at prevailing prices, while 40% or more generally indicates reduced demand. In the coolest markets, when buyer demand is weakest, you’ll see % Price Decreased climb over 50%.
Price decreases also tend to have some seasonality; for example, price decreases happen more in the fall when it’s time to move the listings before the holidays. Keep an eye on the price reductions trend to give your clients the early market signals before they read it in the news.
% Price Increased
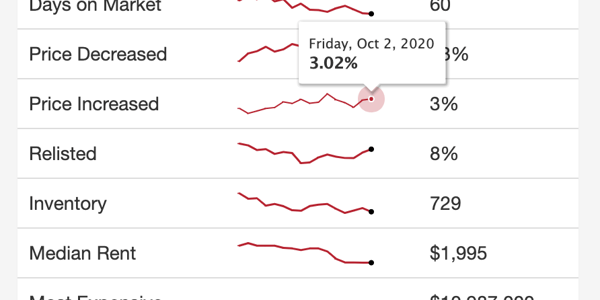
Price increases, on the other hand, are usually under 5%. Properties may get a price increase when an investor buys and flips - when demand is increasing dramatically, price increases can also be a powerful marketing strategy. When you see price increases climbing, it’s often a sign of investor activity in a market, iBuyers and flips - or simply very high demand. This is a bullish signal for future sales prices and home values.
Want to learn more about these stats? Download our eBook "How to Use Market Data to Build Your Real Estate Business."