
Mike Simonsen
Mike Simonsen is the founder and president of real estate analytics firm Altos Research, which has provided national and local real estate data to financial institutions, real estate professionals, and investors across the country for more than 15 years. An expert trendspotter, Mike uses Altos data to identify market shifts months before they hit the headlines.
Has the US real estate market managed to navigate a soft landing? It sure looks that way to me. For several weeks in a row inventory has been rising at a slower pace than we’d projected even a few weeks ago. In fact we should probably revise lower our projection for where available inventory finishes 2022. The economy has been strong and unemployment is remarkably low, and even with shrinking GDP, the American homeowner is in great shape.
There is no panic selling. We saw some sellers rushing to list in May and June, anticipating that things might get worse. I am hearing anecdotes from brokers around the country with those stories. But that only means inventory will grow less this fall. These are the dynamics we’re watching in this week’s Altos Research market update.
Every week Altos Research tracks every home for sale in the country. We analyze all the pricing, supply and demand, and all the changes in that data and we make it available to you before you see it in the traditional channels. If you aren’t using Altos market reports with your clients, your buyers and sellers, now might be the time to step up. Go to AltosResearch.com and book a free consult with our team. Because everyone is worried about what’s happening right now. They need you to help them see clearly.
I’m Mike Simonsen, I’m the CEO of Altos Research. Here’s what we’re looking at for the week of August 8 2022.
Real Estate Inventory
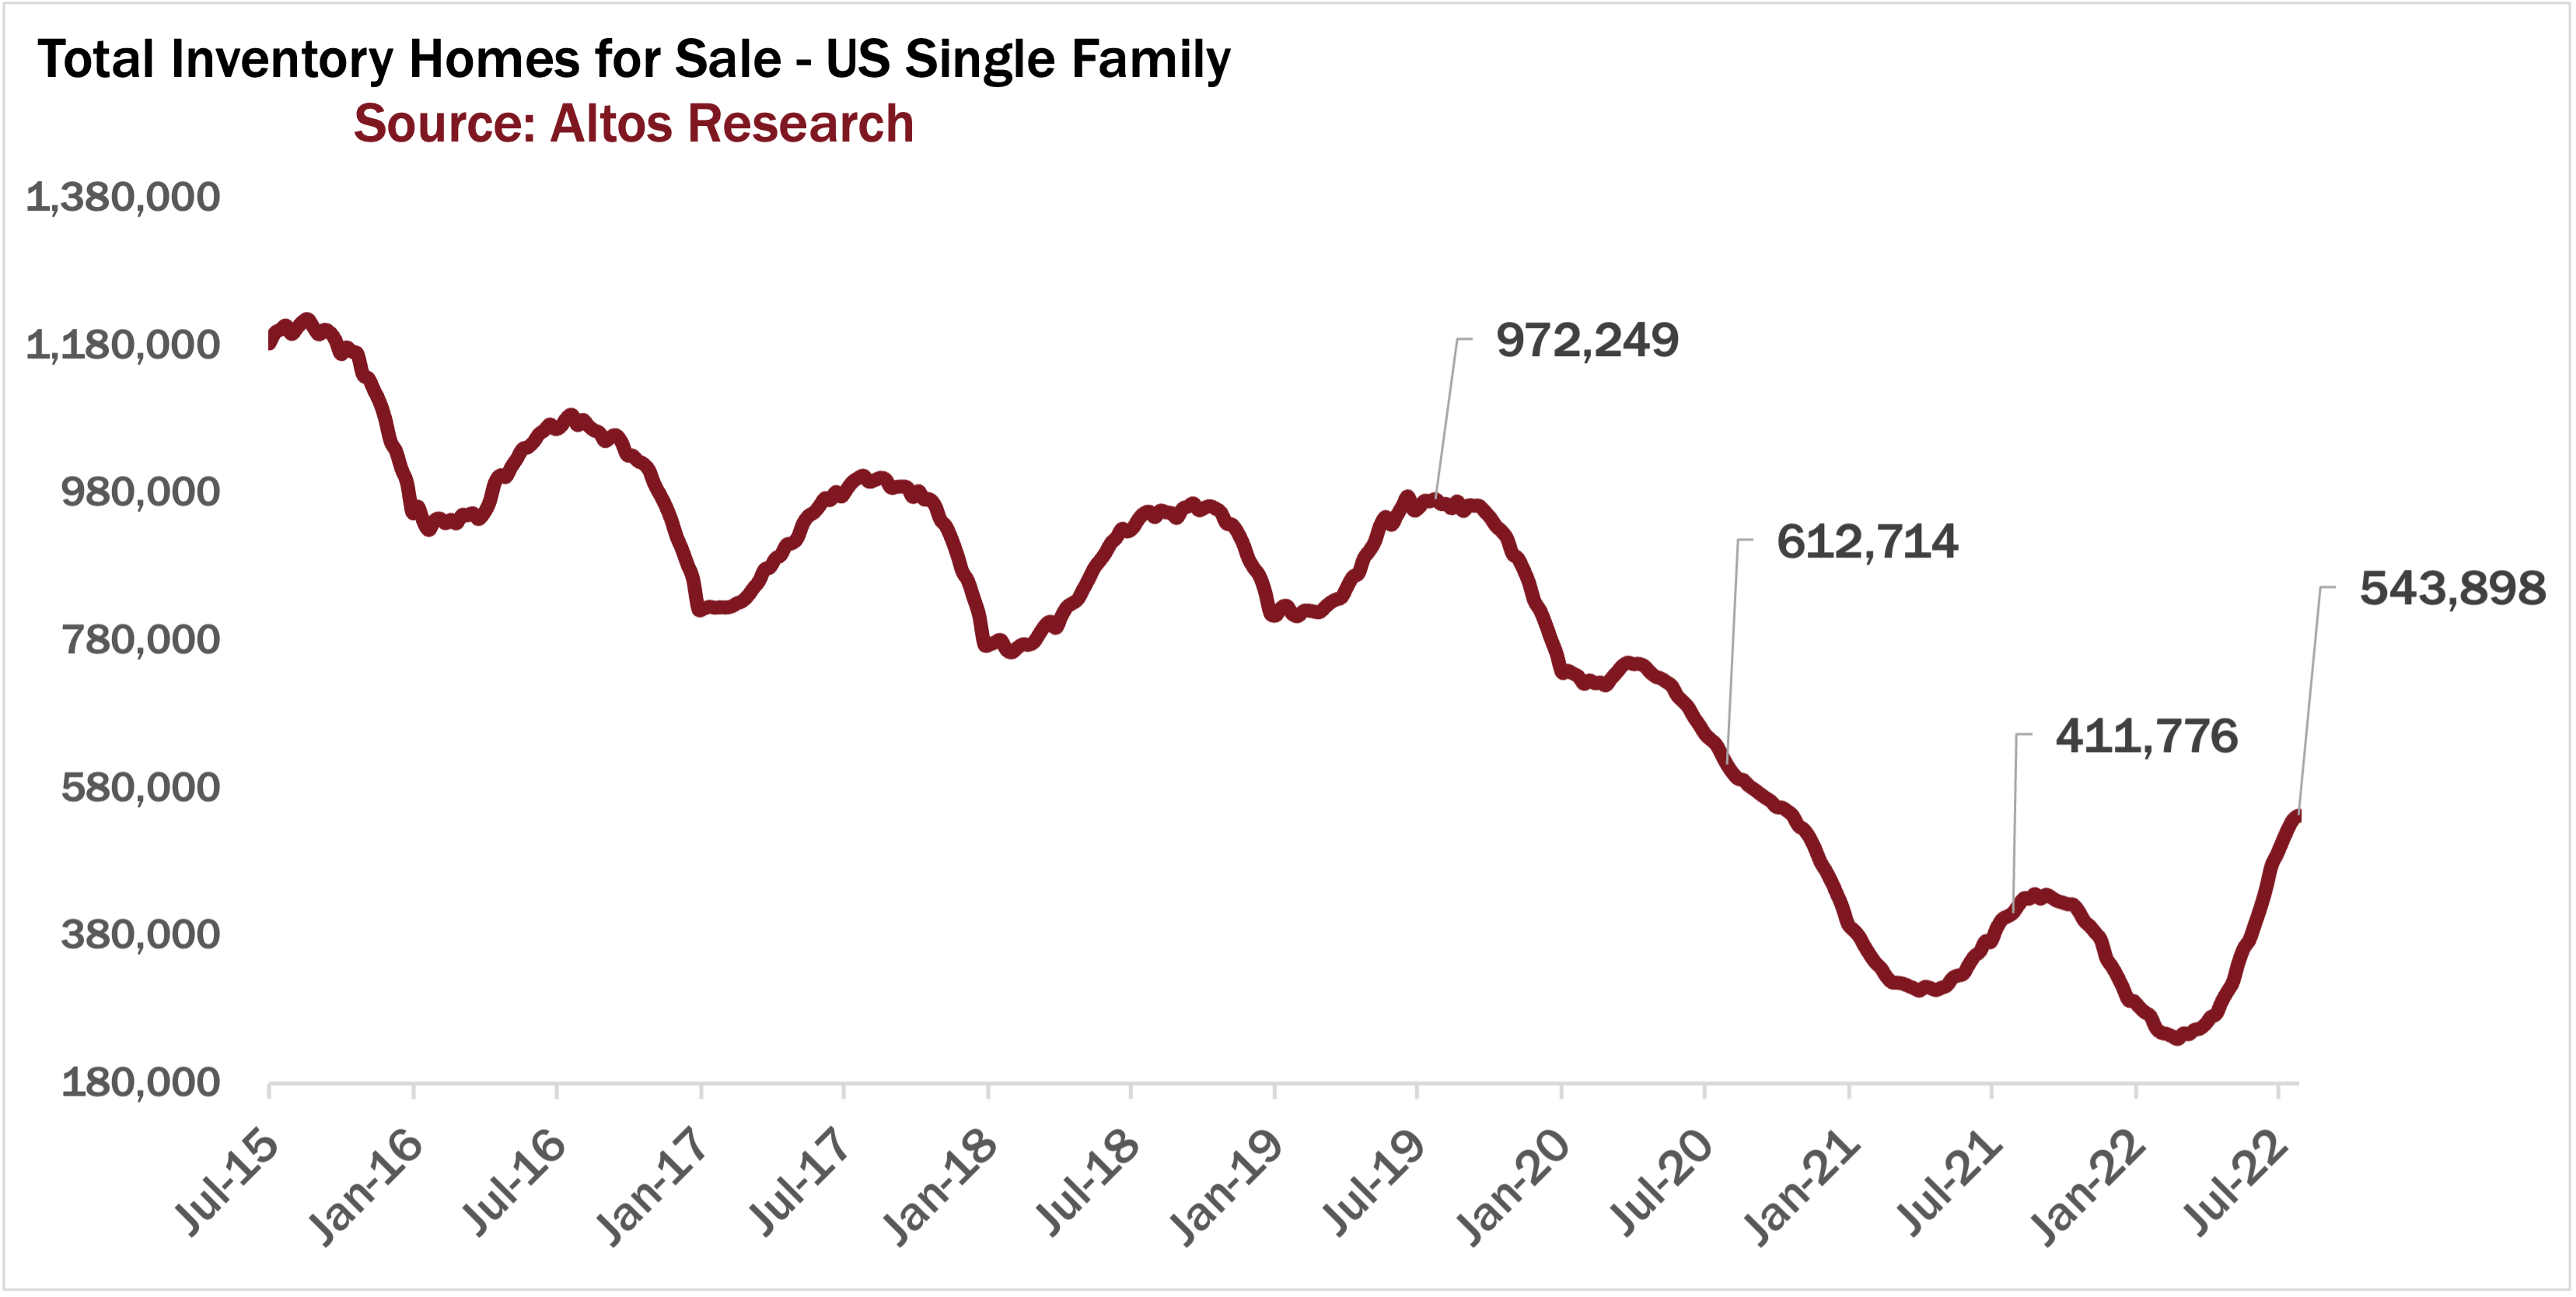
Available inventory of homes for sale rose by less than 1% this week to 544,000 single family houses unsold. Inventory is rising, but rising less quickly than it did in the second quarter and also less than in any August of the last several years. In June inventory was rising by 6-8% per week, in July 3-4%, this week less than 1% inventory gains.
This is a normal seasonal slowing. In a sense it’s not at all notable that inventory rises in June and July and flattens out in August. The reason why slowing inventory growth is the headline now is because we expected inventory to just keep climbing. Or feared that inventory growth would accelerate. In many of the hottest US housing markets, demand stopped abruptly in the second quarter. You can understand why people would be afraid of a market crash. But man, that sure doesn’t appear to be happening.
You can see that we have 32% more homes on the market now than we did last year at this time. We still have fewer homes on the market than 2020 and 40% fewer than 2019. In most of the country, we still have a shortage of homes available for buyers. It seems remarkable to say that. But that’s where we are.
What’s hard to see on this chart is the change in the slope at the far right side. It looks to me like we’ve turned the corner for the season.
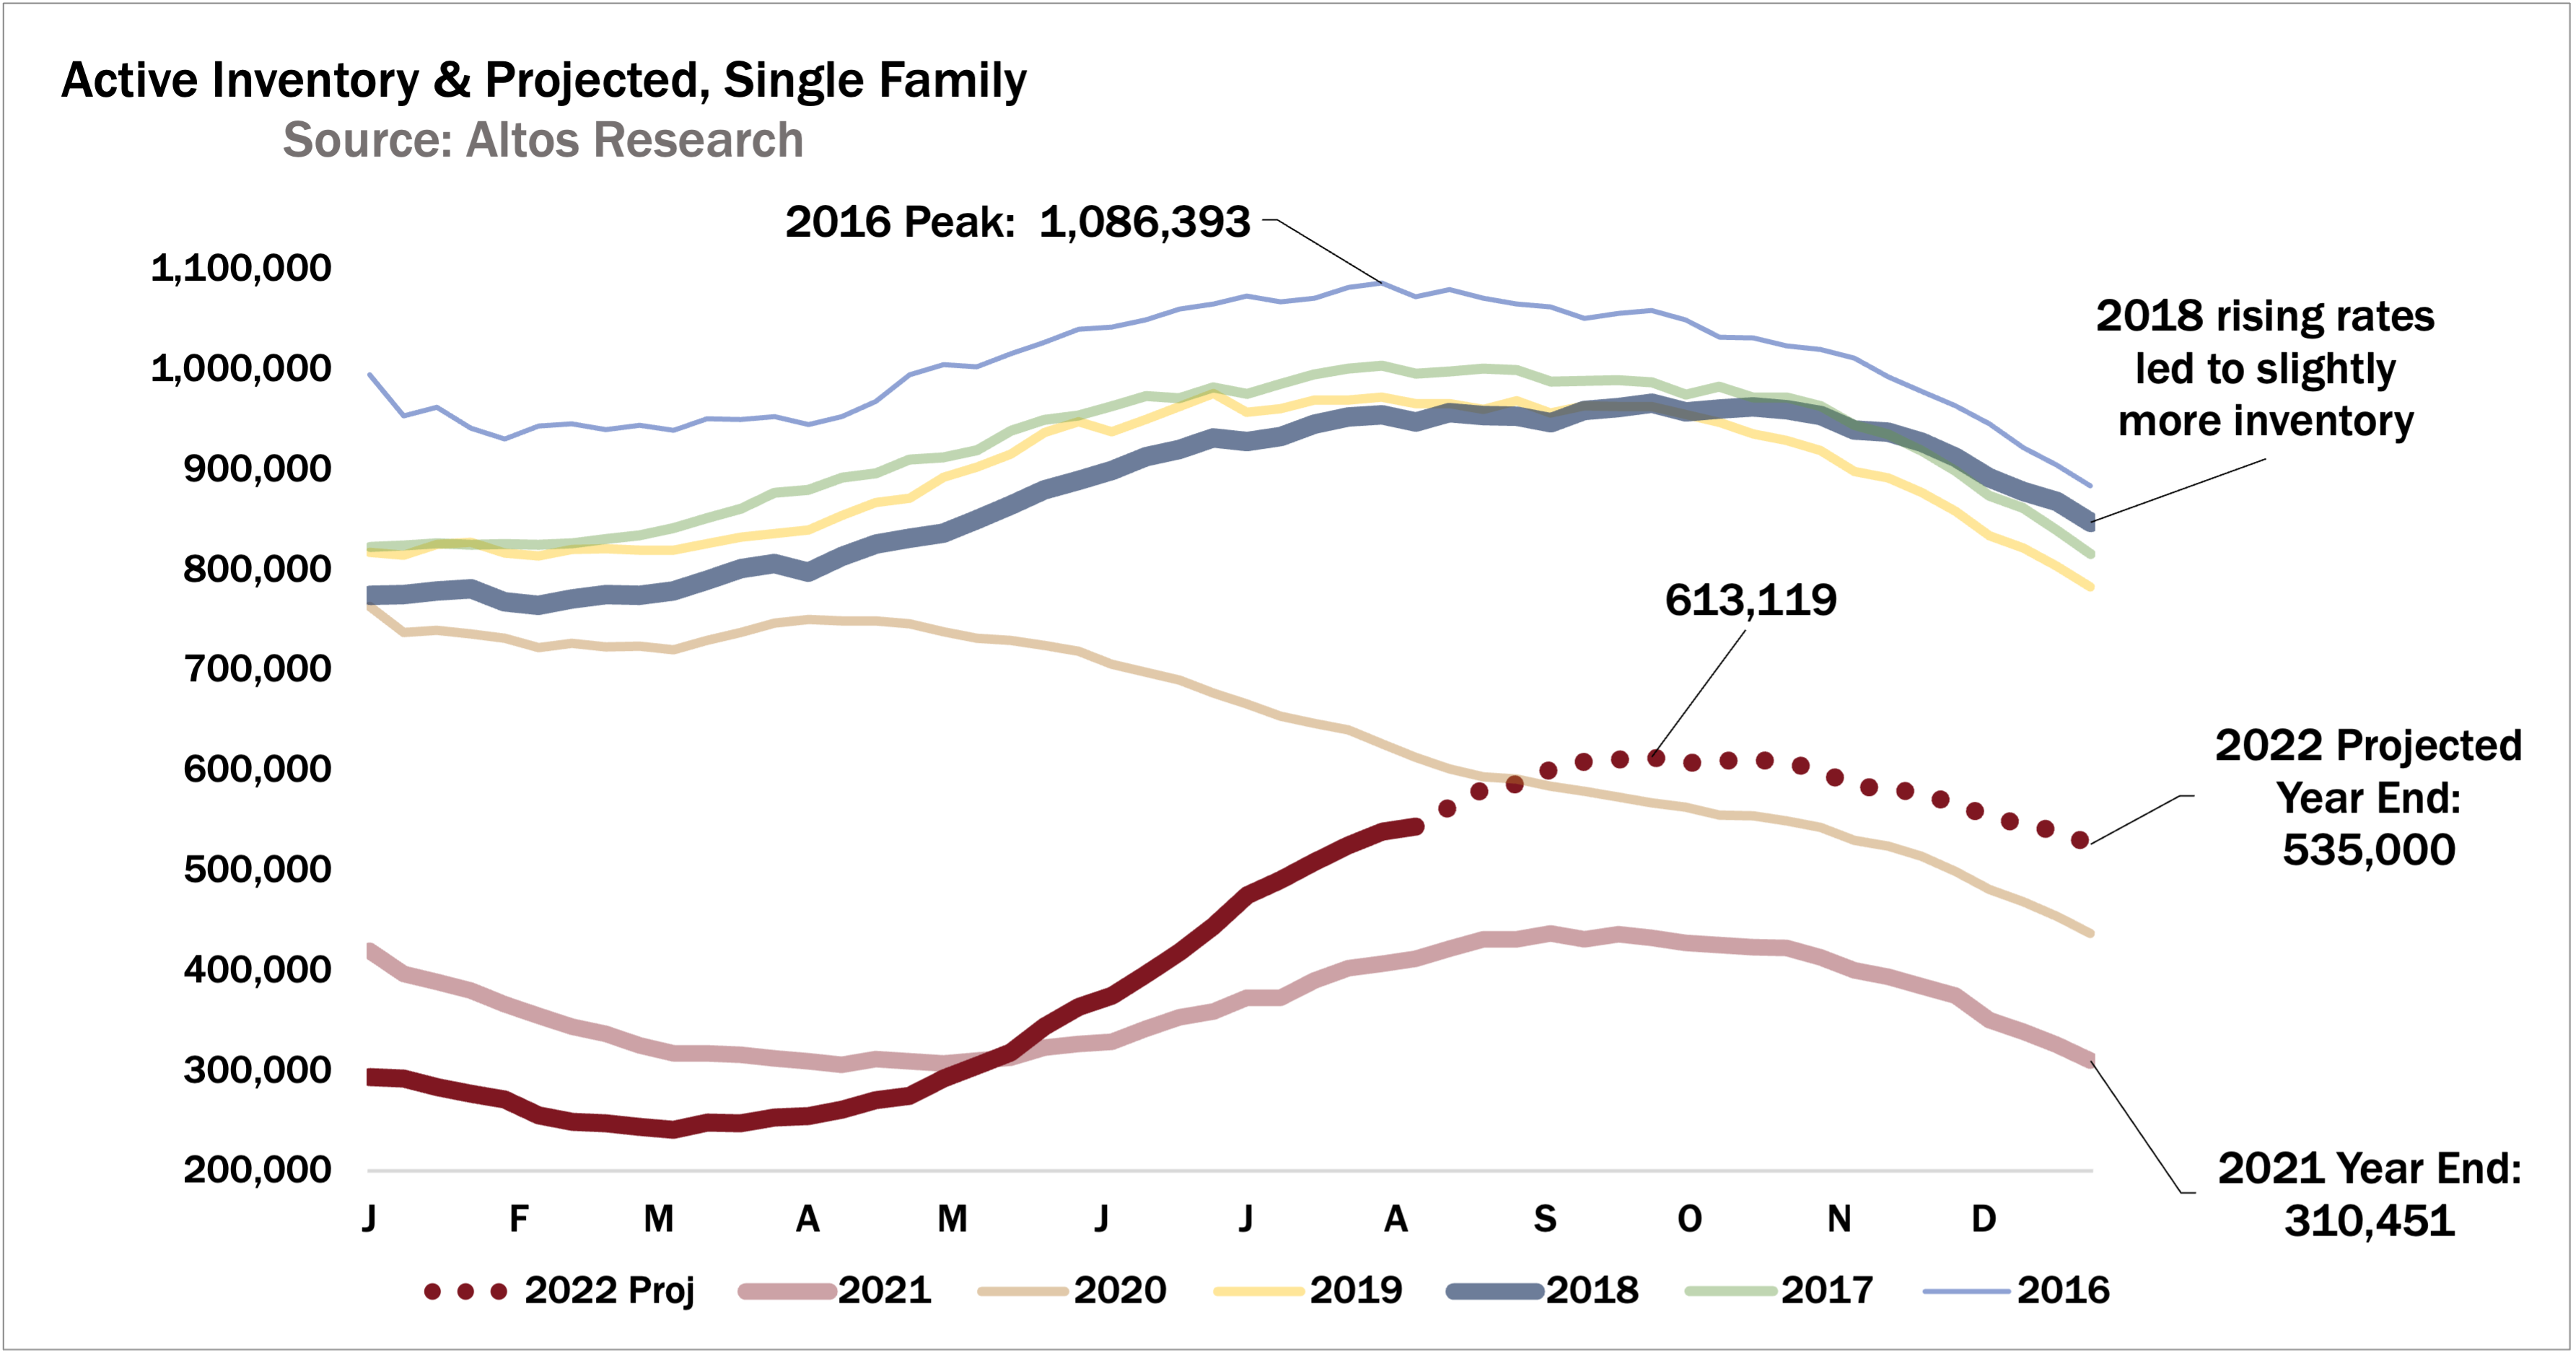
If we look at the same data in the year over year format we can see the last few weeks how the slope has changed. This is a simple forecast model for inventory for the rest of the year. The solid dark red line is this year so far. As the dotted line plays out each week for the rest of they year you can see we’re still allowing for weekly jumps next week and the rest of August.
If we don’t have those jumps, then we’ll revise down the yearly forecast. The bottom line here is that available inventory is not growing particularly fast any more. We’ll probably end the year with about 535,000 single family homes on the market. I shared this 535,000 number a few weeks ago and a lot of really smart people told me it was too low. But suddenly it looks maybe too high. We’ll see the next week brings us.
We have our August webinar this week Thursday the 11th at 10am Pacific. In it, we’ll spend more time on this surprising change in the inventory trend and what to expect for the rest of the year. If you have buyers or sellers trying to figure out how to navigate the market this fall, you should join us. One thing to note is how many local markets are behaving differently. We’ll check on some of those markets and see if they look better or worse than the national average. If you’re having these conversations, register now.
Immediate Sales Tracker
You can see this slowdown in inventory growth in the immediate sales tracker. Note the sharp drop in new listings and in the immediate sales after the July 4th holiday. I’ve pointed out that immediate sales were the defining characteristic of the pandemic housing boom. Since the July 4th holiday, you can see the abrupt drop in new listings and the drop in those that go into contract immediately.
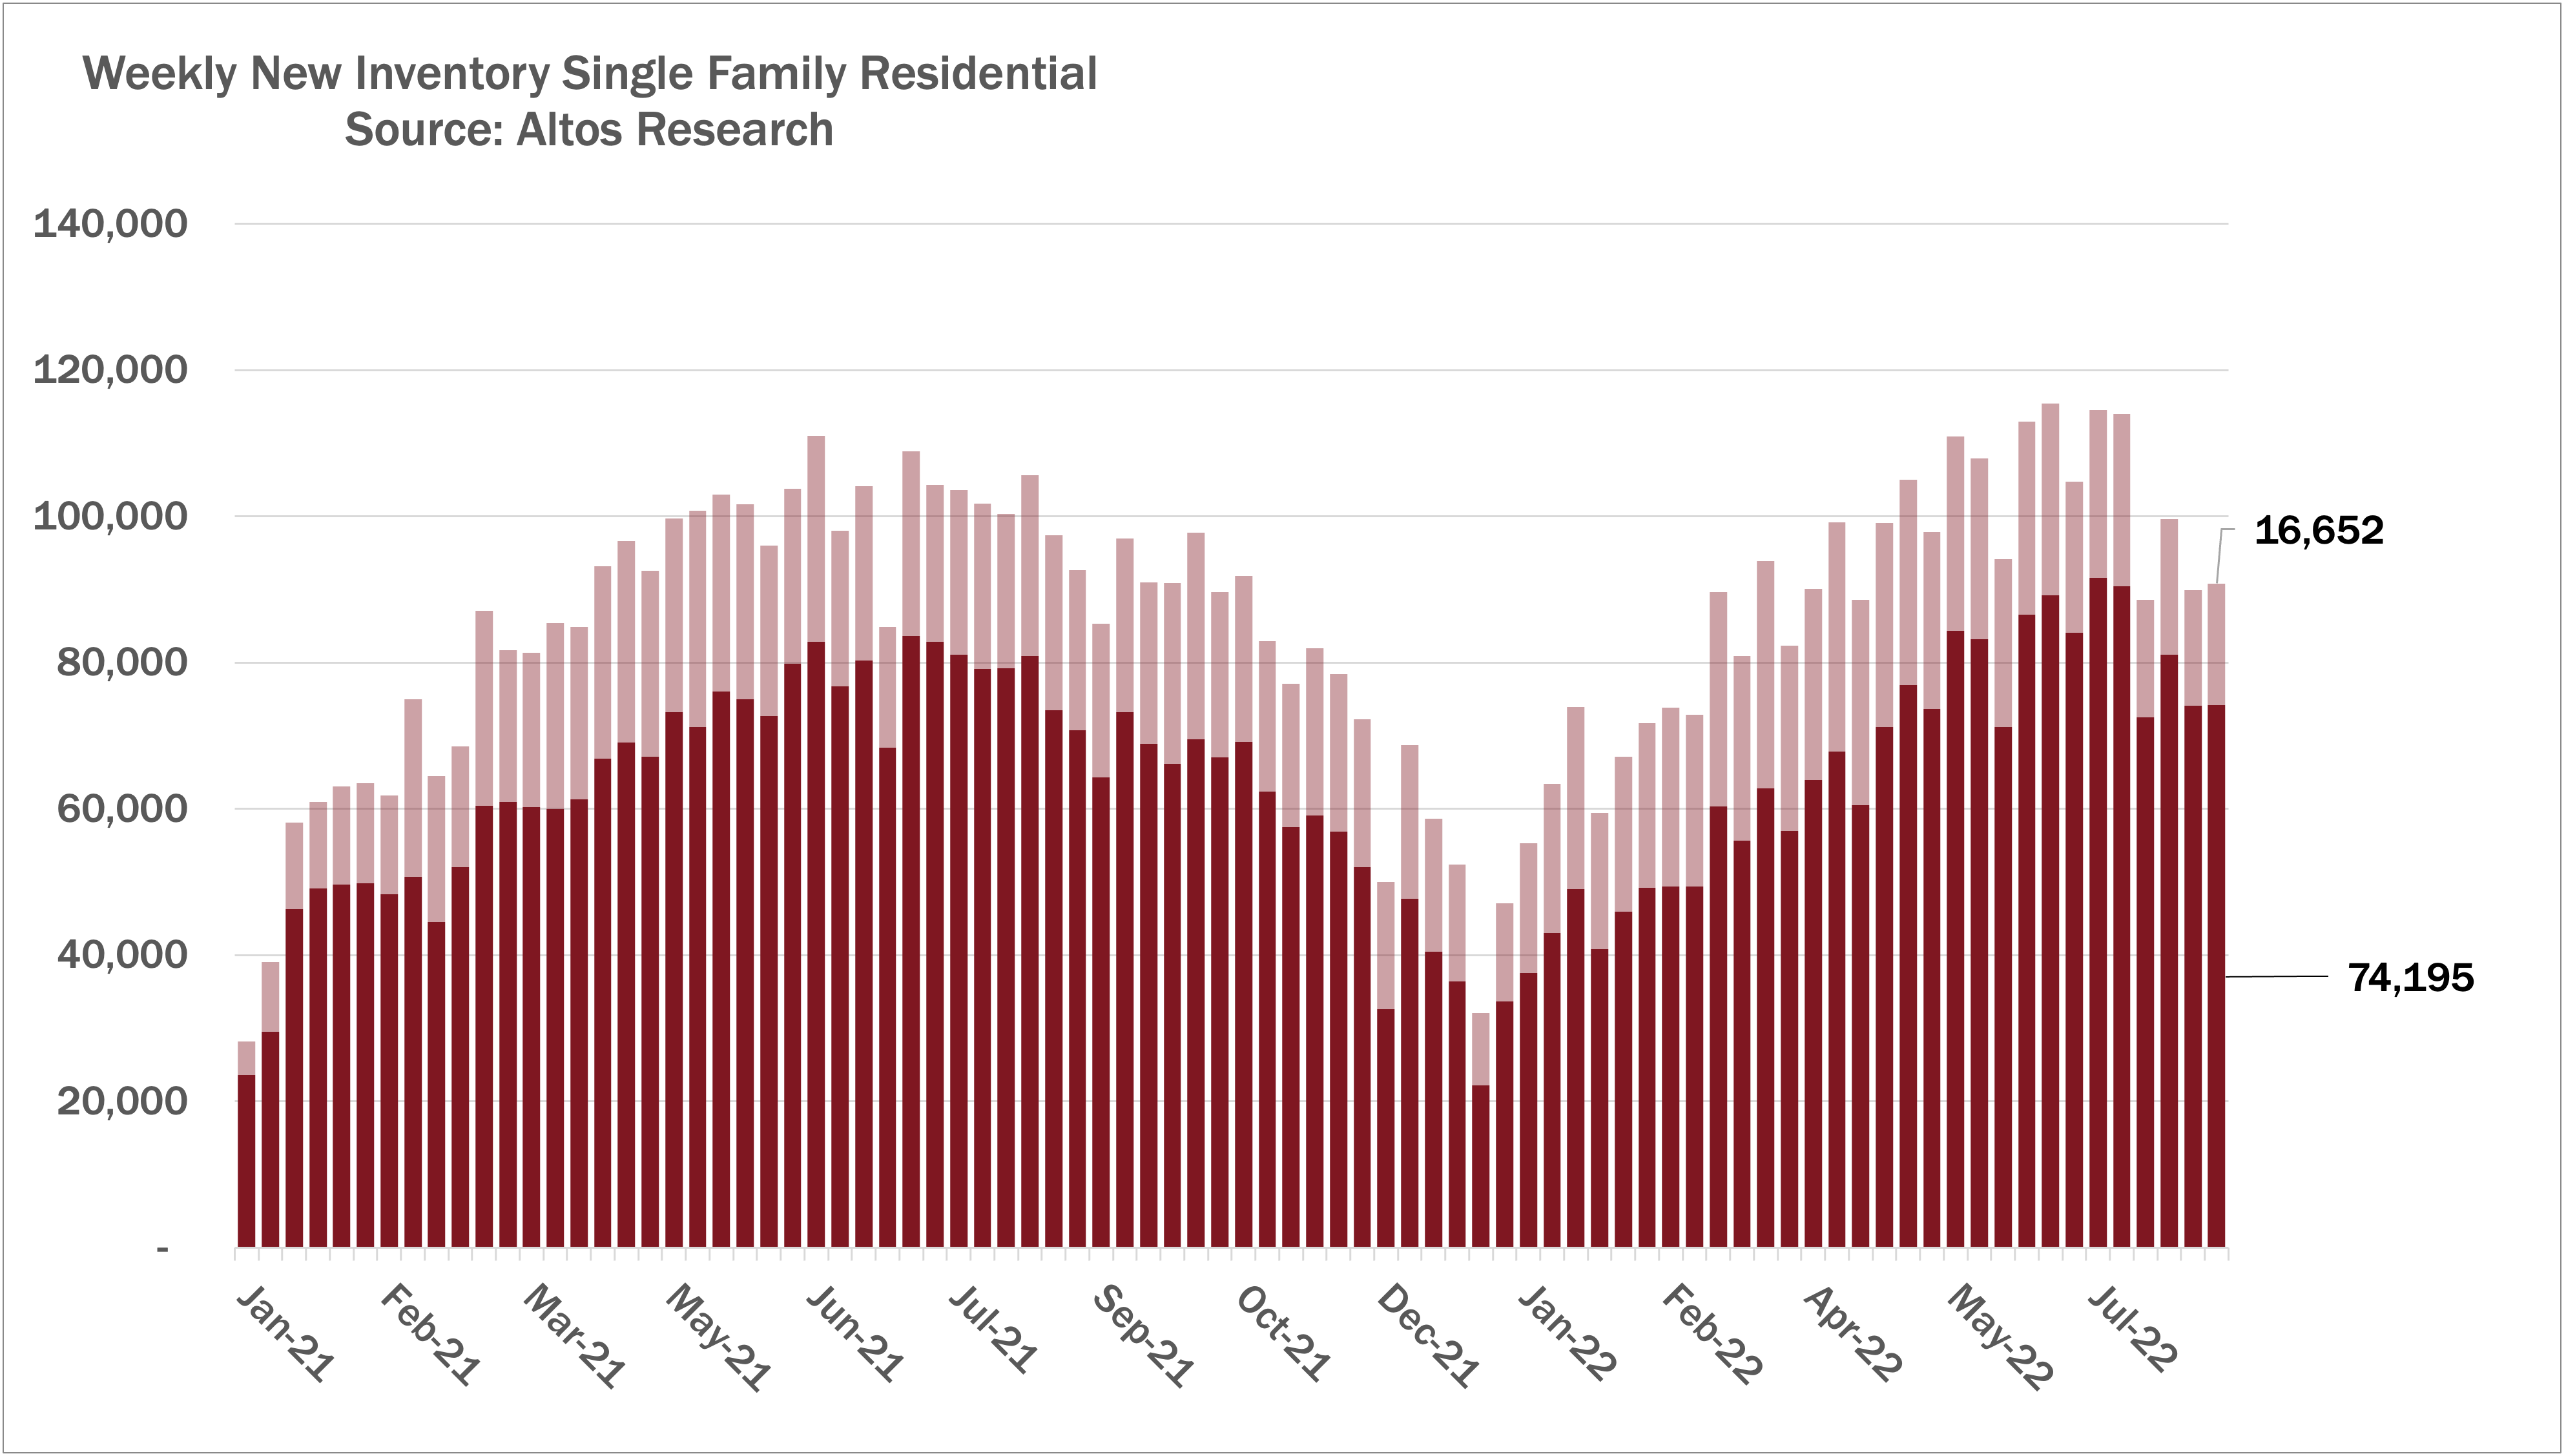
The dark part of each bar here are the listings that stay on the market more than a few days. The light part are those that list and go into contract essentially immediately. Only 16,000 of those this week.
Real Estate Prices
Home prices meanwhile are holding firm. That’s another sign that the market may be navigating a soft landing. The median price of single family homes in the US is just under $450,000 now, roughly where it has been for a month.
The price of the new listings is down to $399,900 and this decrease looks like mostly seasonal action. See the light red line here. Each year the new listings price moves down in the late summer and fall, which we see now. Percentage wise, the price of new listings has not retreated much.
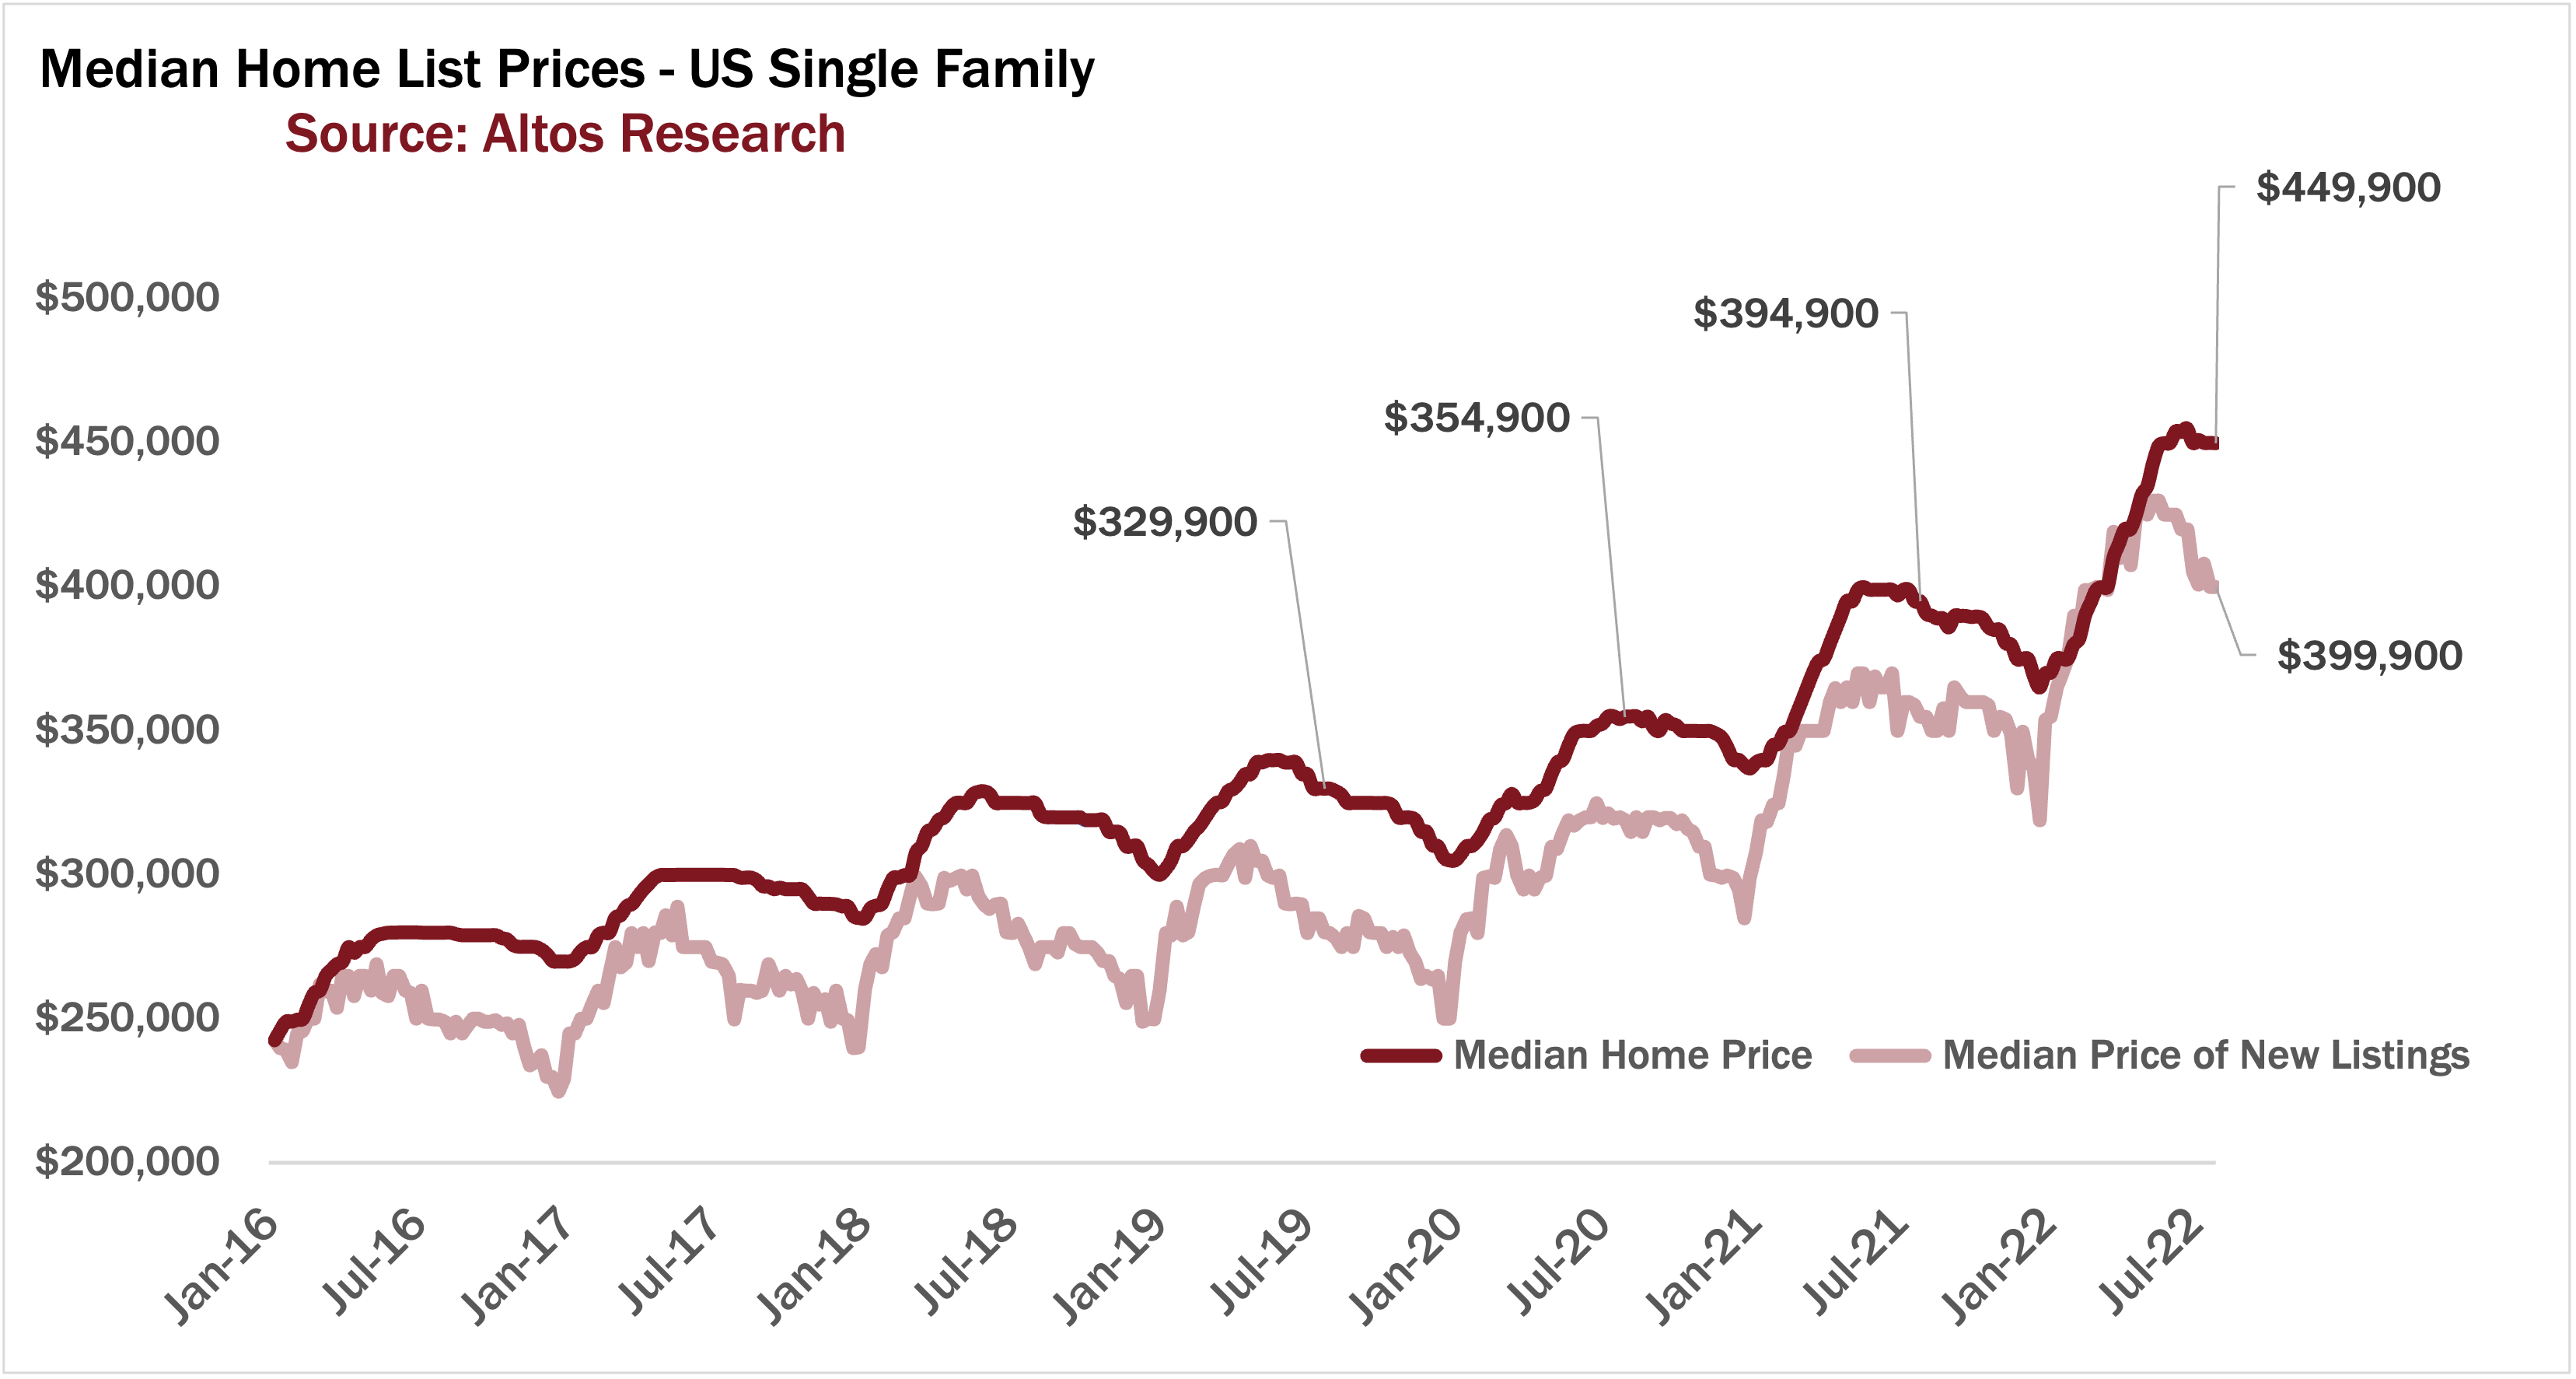
But you can see that we’re well past the insanity of the beginning of the year where the light red line was spiking so quickly each week. This implies that while the most egregiously overpriced homes are not selling, in general sellers and buyers are finding equilibrium.
Real Estate Price Reductions
It looks like we’re seeing a slowing growth in price reductions too. More homes are cutting their prices each week now. The time to sell a home is climbing of course. And price reductions always climb this time of year. As the market shifted many sellers were surprised and had to cut their asking prices very quickly so we had this big steep increase in price reductions from record lows, to the highest numbers in years.
I expect that by September the rate of price reductions will have leveled off. That’s the dark red line here. We’ll have 40-some percent of homes on the market in September with price cuts. That’s a lot compared to recent years, but not frighteningly high. If this dark red line was still going vertical each week, that would be alarming.
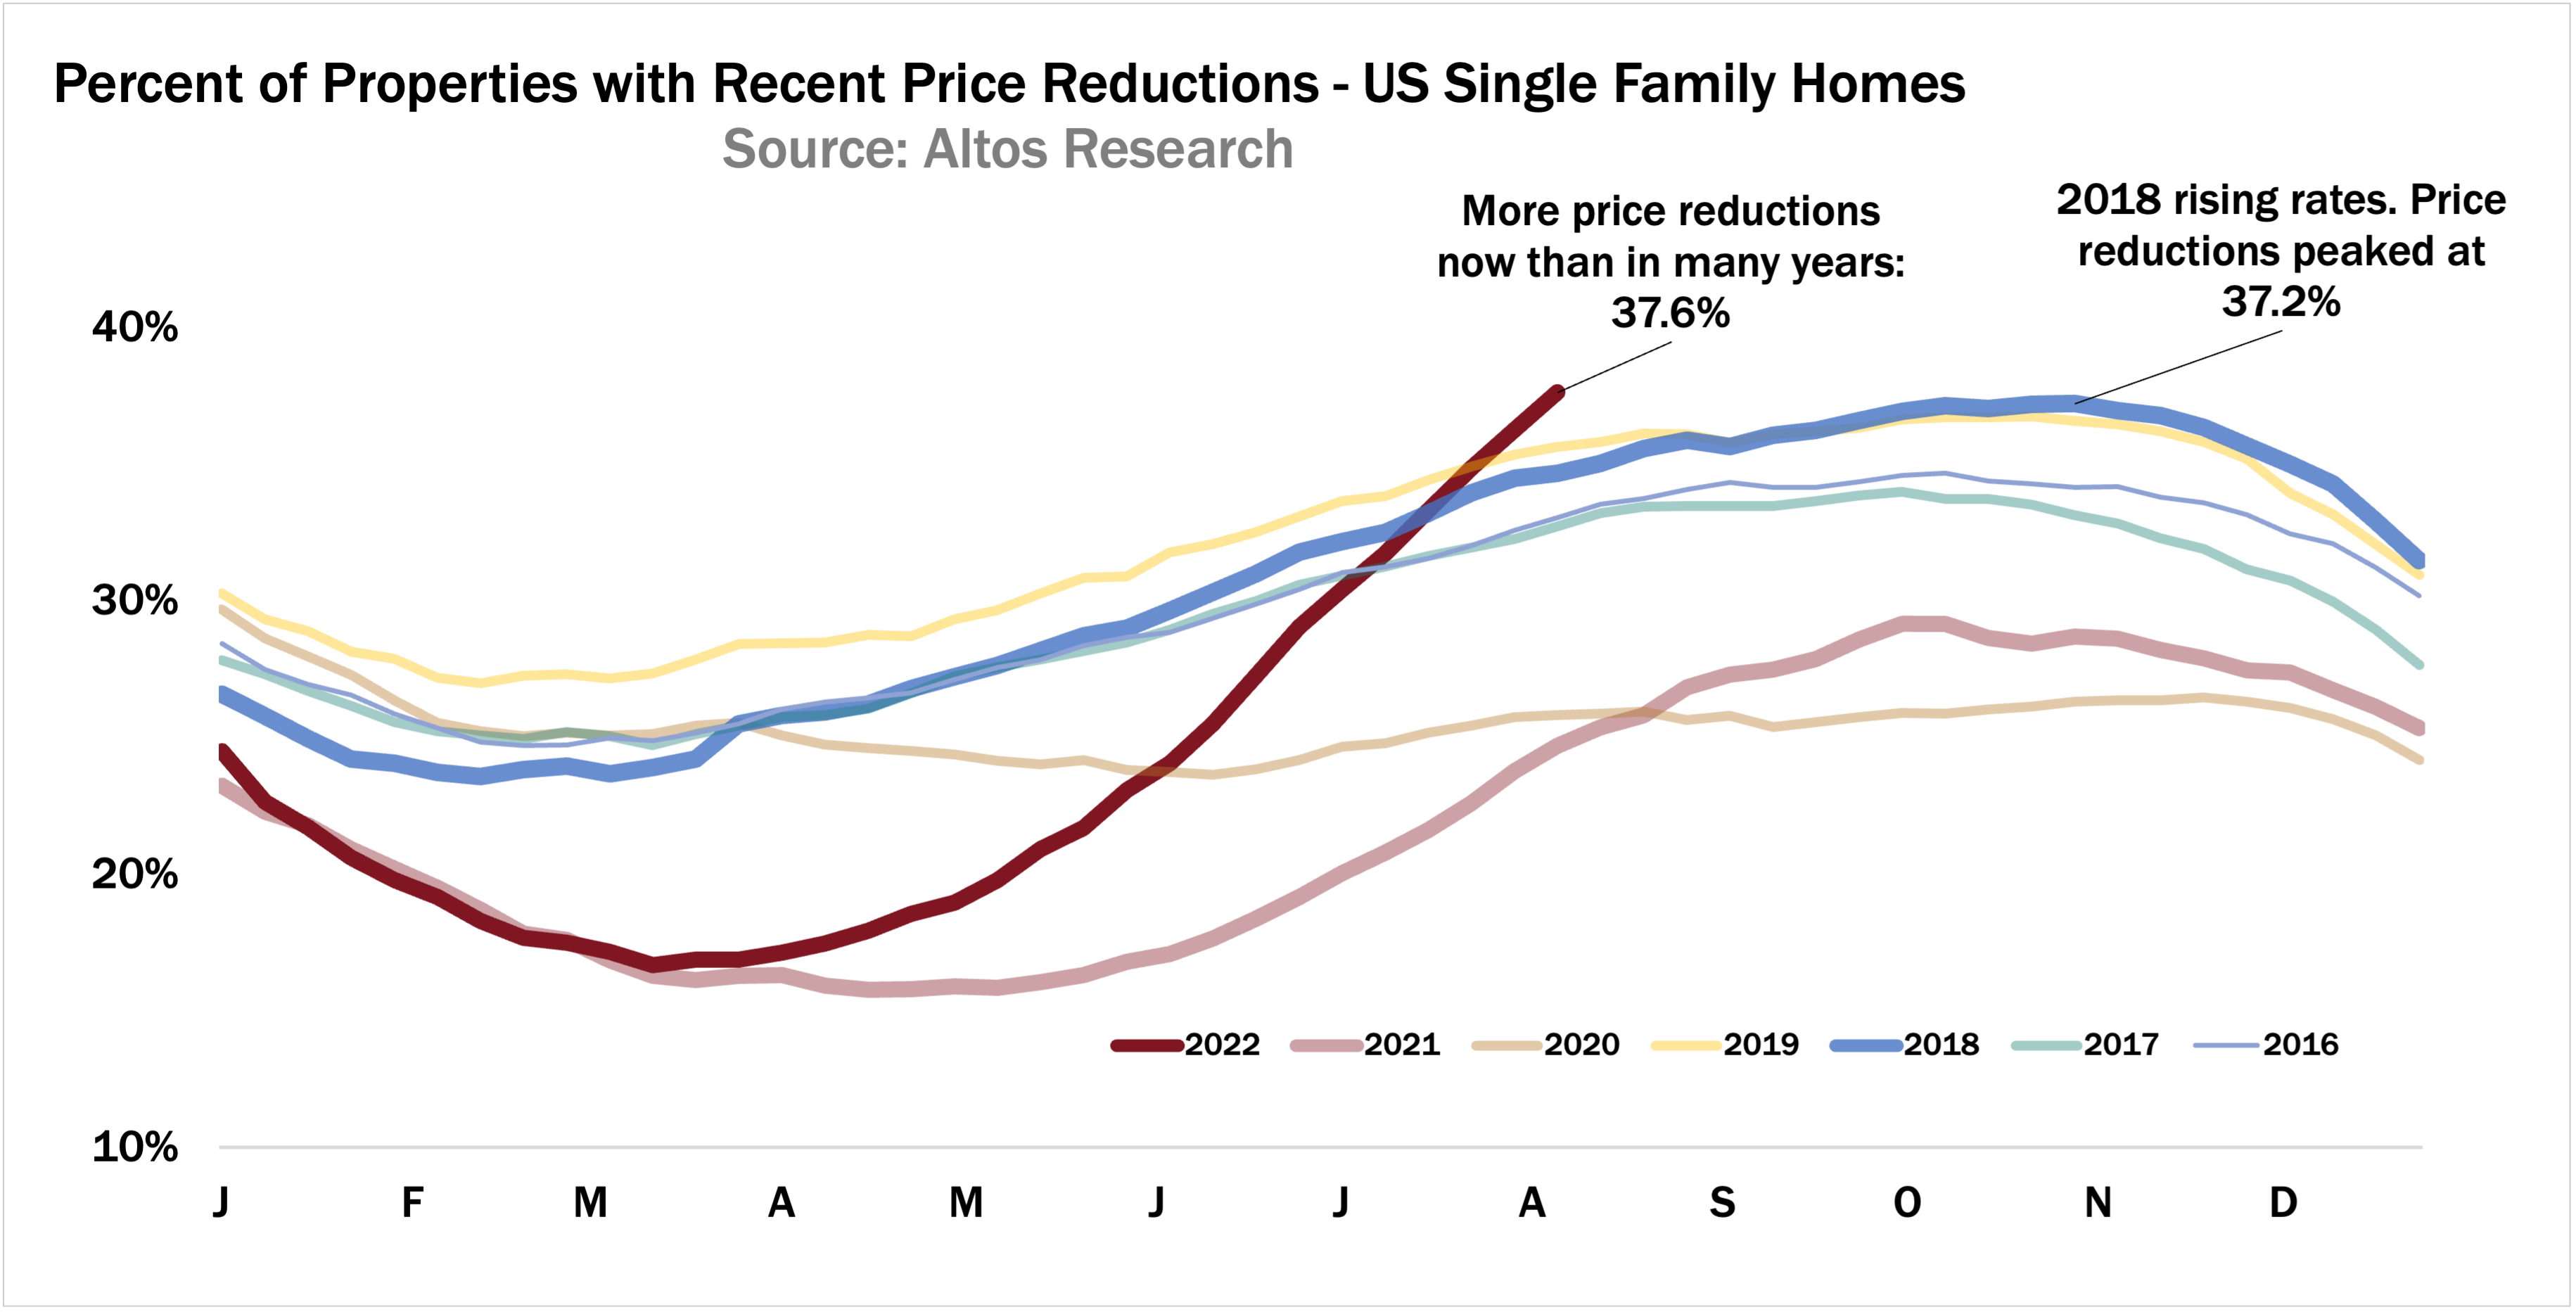
It looks like it’s starting to slow just a bit. Currently almost 38% of the market has taken a price cut, next week you can see 39% then 40%. Some time in October we’ll peak before resetting for the holidays.
This tells us that if you’re a buyer right now, you have more options than you did at the start of the year, but the current signs don’t show the market changing dramatically from here. Mortgage rates have fallen off their highs. Employment is high. People who want to buy are buying. This seems very much like a soft landing to me.
We’ll take the full hour to discuss these trends and much more this Thursday. Join us. As always if you need to have these types of conversations with your buyers and sellers right now, you should go to AltosResearch.com and sign up to get the data in your hand and in their hands today. Local data for every zip code in the country. This market is changing much more quickly than most buyers and sellers can keep up. They need you to be their voice of expertise, right now. Join us at AltosResearch.com