
Mike Simonsen
Mike Simonsen is the founder and president of real estate analytics firm Altos Research, which has provided national and local real estate data to financial institutions, real estate professionals, and investors across the country for more than 15 years. An expert trendspotter, Mike uses Altos data to identify market shifts months before they hit the headlines.
Almost ready to wrap up the year! Available inventory of homes for sale ticked down again this week. How low will our available supply of homes go? And we’re getting some fascinating demand signals right now too. So that’s what we’ll look at in this week’s Altos Research market update.
Each week Altos Research tracks every home for sale in the country, all the pricing, supply and demand, and all the changes in that data and we make it available to you before you see it in the traditional channels.
It’s Monday December 13, 2021. This is the last non-holiday week of the year. Though we actually have three more reports of 2021 data still to come.
Here’s what the real estate market is telling us this week:
Active inventory of unsold single family homes ticked down again this week just as you’d expect for mid-December. We’re down to just 339,000 houses on the market. You can see each year’s cycle here.
Notice how each year we have smaller available inventory than the year prior. That’s because Americans keep turning their houses into investment properties for rent.
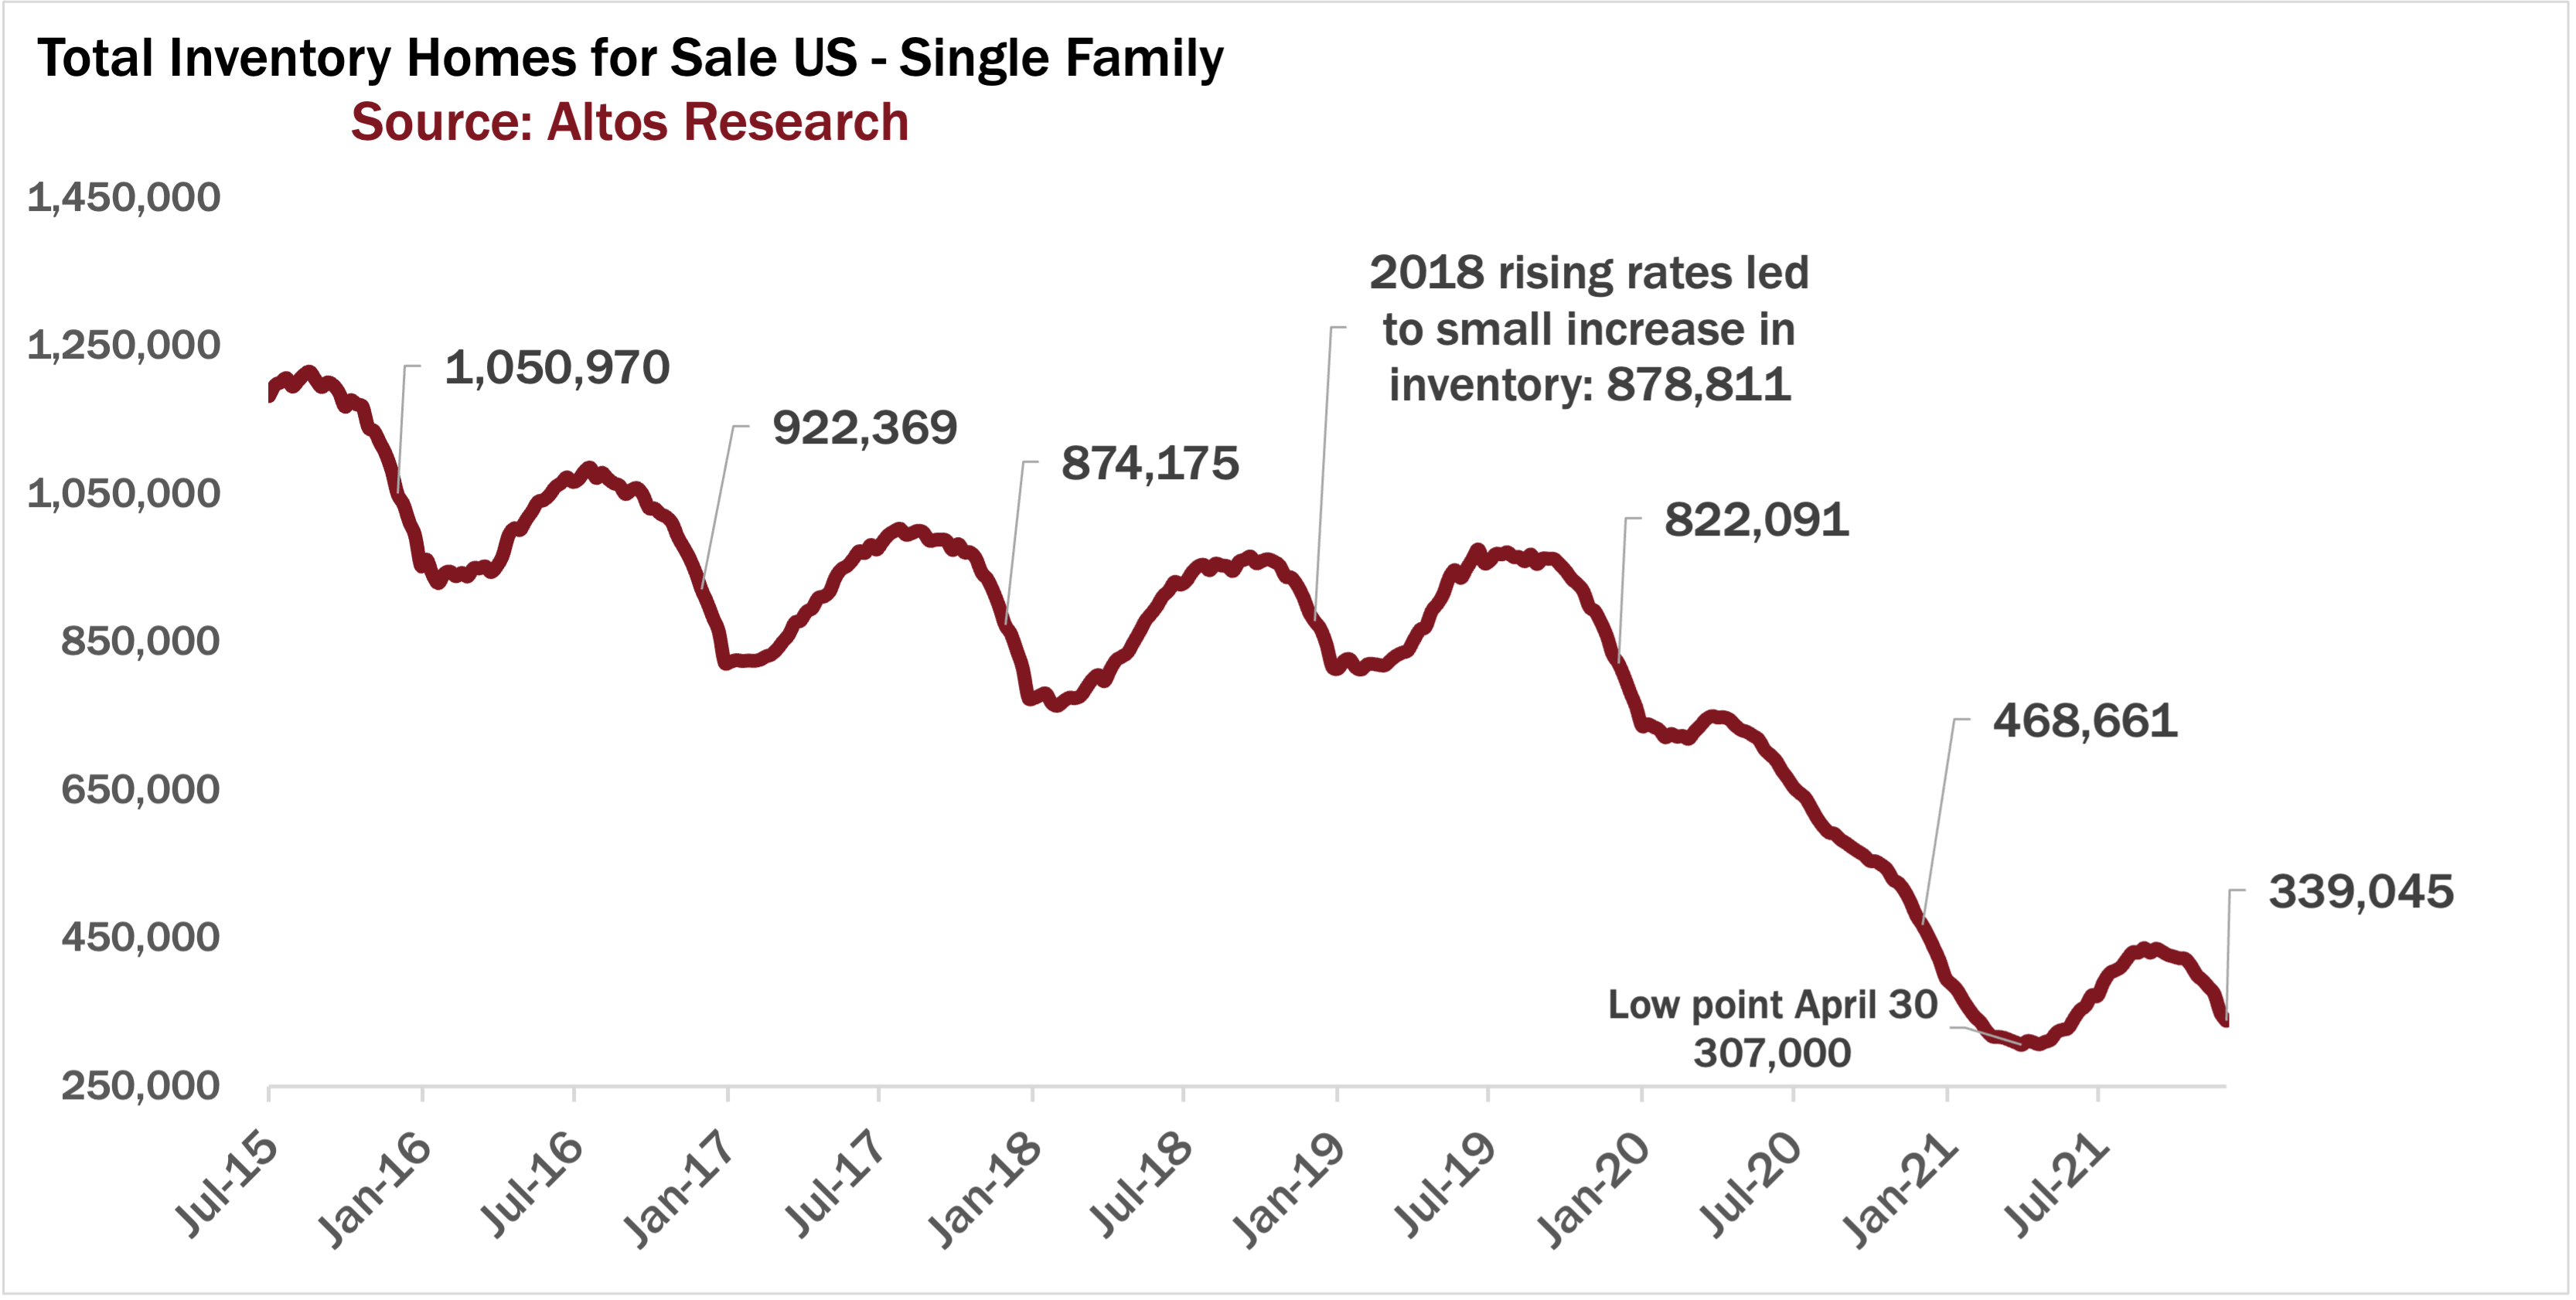
The only year where inventory didn’t fall was at the end of 2018. If you remember that time three years ago, mortgage rates rose for most of 2018 - for sellers at the end of 2018, you could feel the lower demand and as a result available inventory climbed just a touch.
This is a signal to watch for in 2022. If rates rise, I don’t expect a market crash, but we could expect slightly improved inventory situation. I think that would be welcome by all participants.
Interestingly as much as I keep expecting rates to rise, they have held very steady all year long. Maybe that’ll change in 2022? We’ll keep watching to see.
By the way, if you pay close attention to our inventory numbers, you may notice a difference between how Altos Research reports available inventory and other sources, for example NAR.
We often get questions about the difference and it’s very useful to understand, so during our webinar this week one of the places we’ll spend some time is looking at inventory, how inventory should be measured, how Altos is different from other sources, and how to communicate about current inventory numbers with your clients.
If you have buyer and sellers who need to understand the market, you should join our webinar this Wednesday December 15 at 10am Pacific. Register for the webinar here. This will be our final webinar of the year so you don’t want to miss it.
New listings this week rebounded from the Thanksgiving week data as you’d expect. But demand as we measure by our immediate sales tracker is staying elevated. 21,000 homes got listed and went into contract essentially immediately.
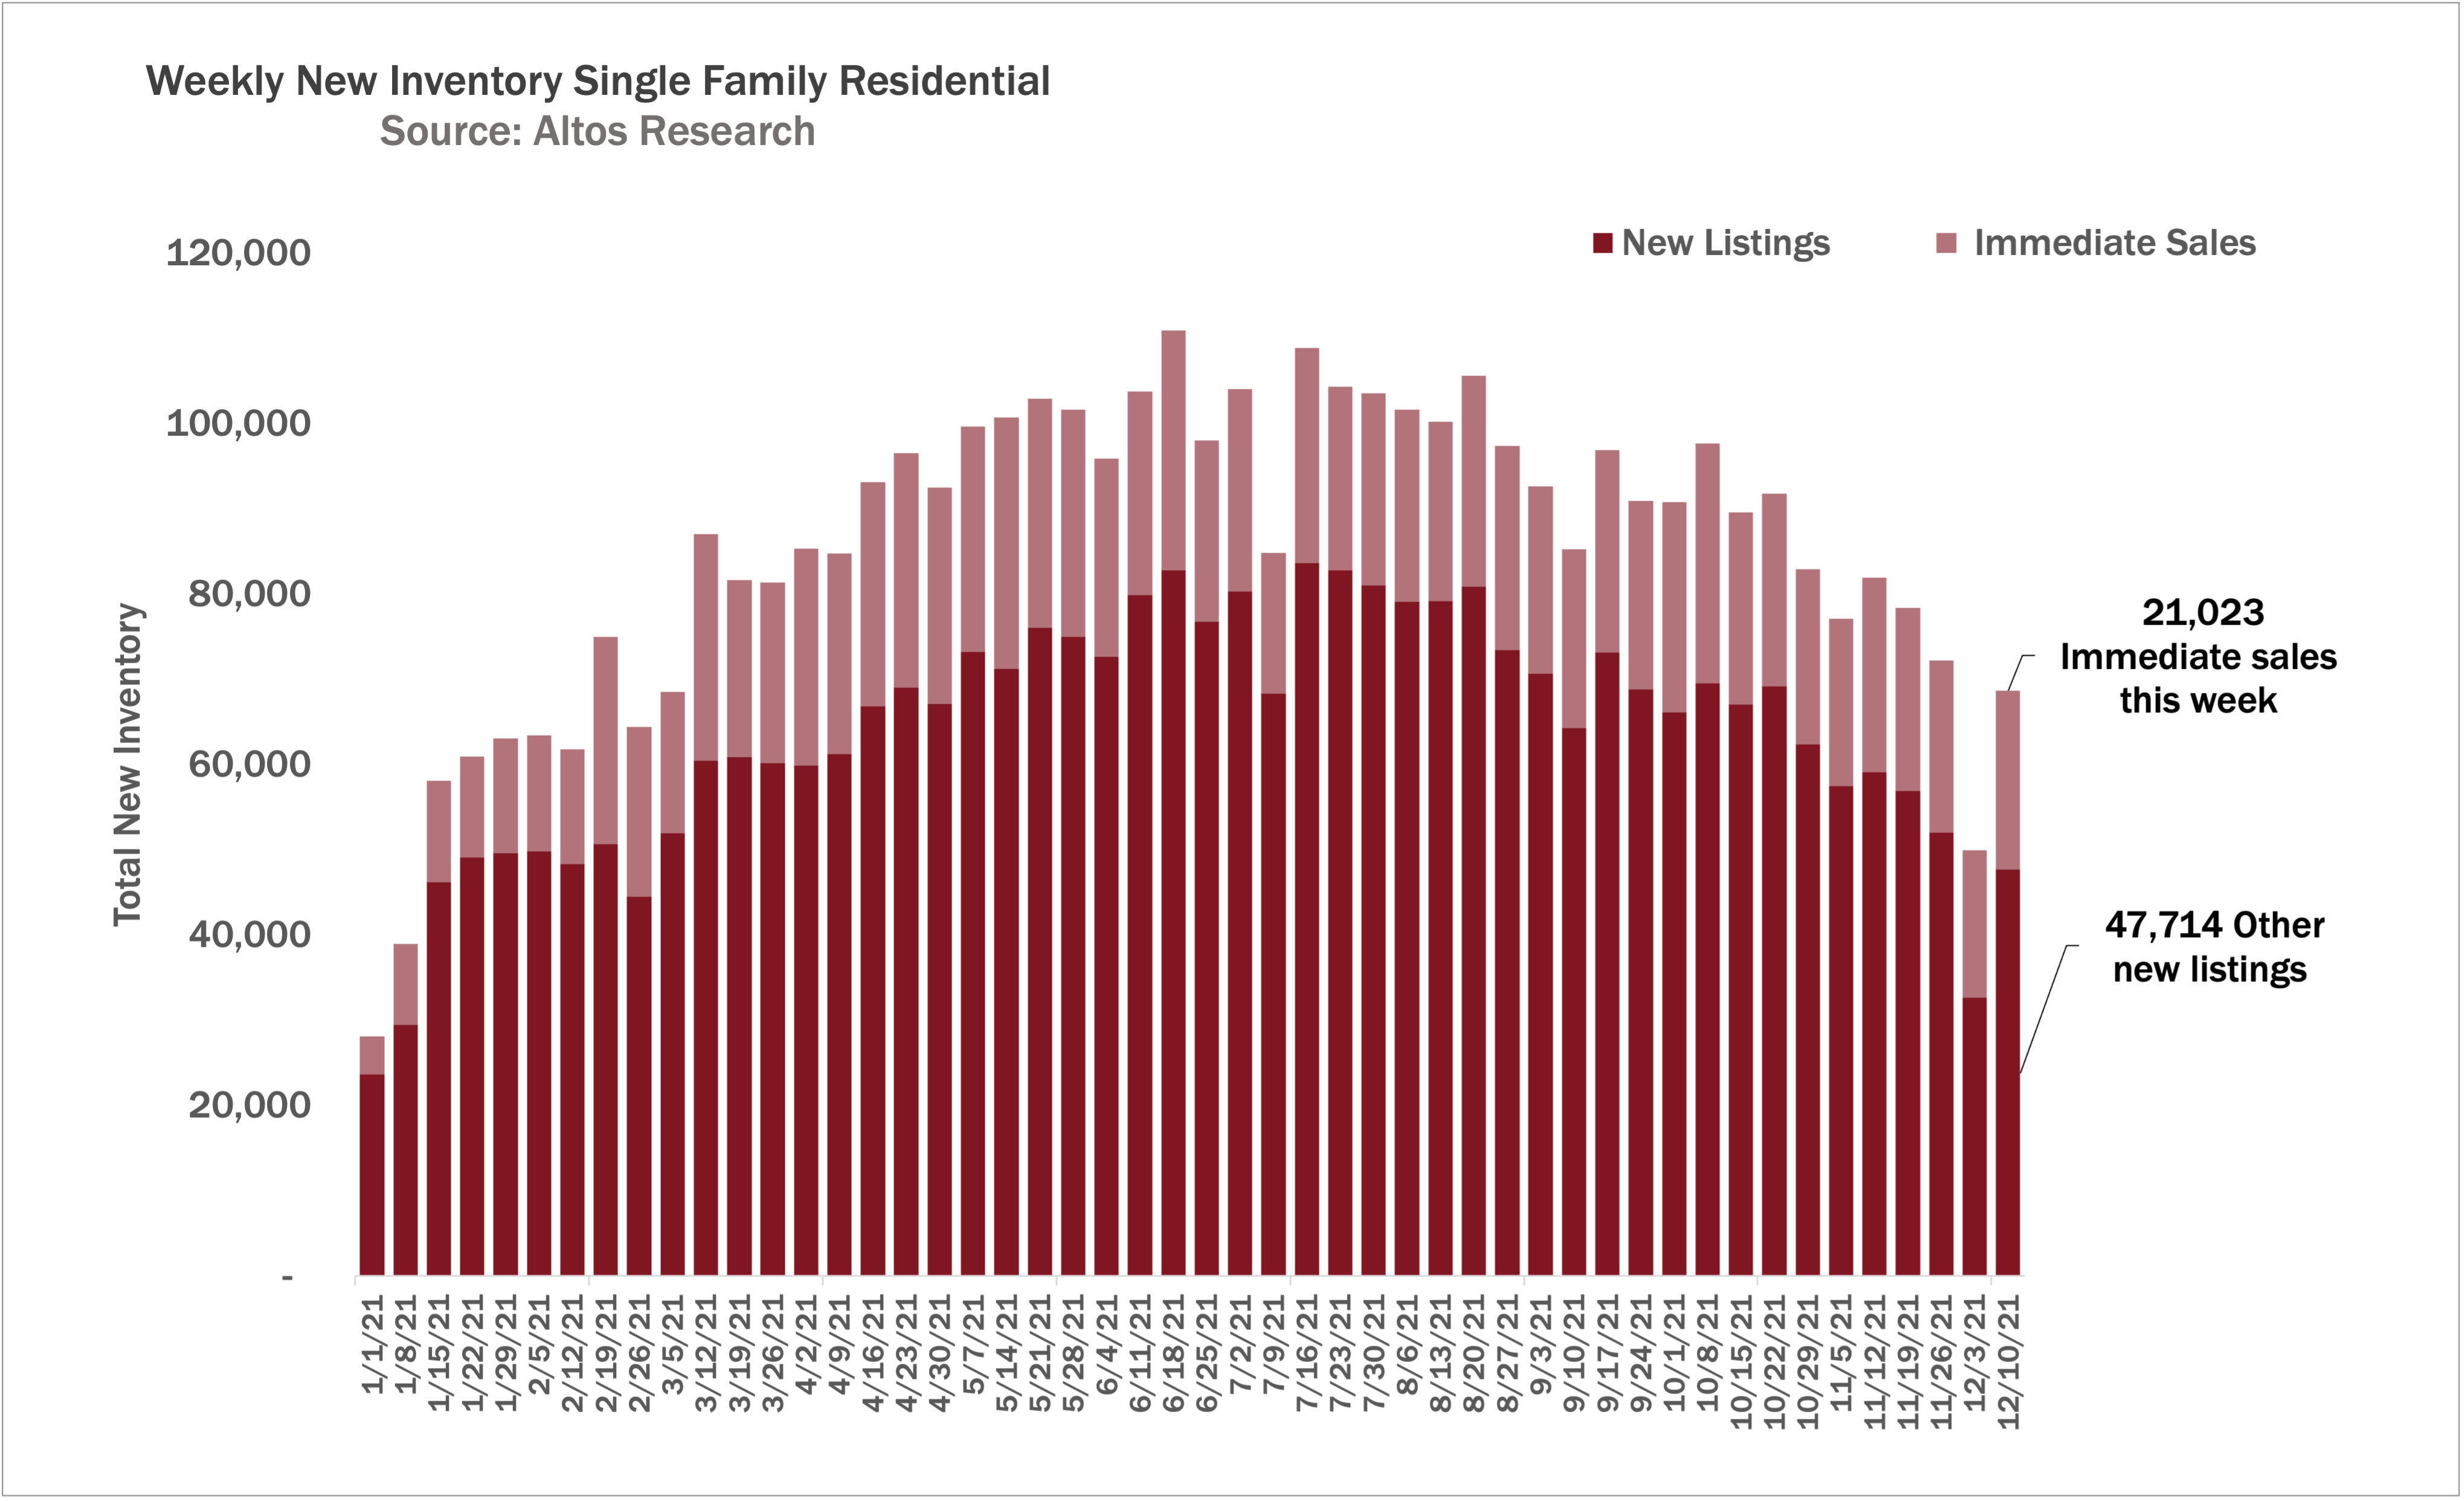
You can see the total volume easing down each week from the annual peak of June/July period. Total volume will keep declining until the second week of January. It’s going to be fascinating to see how Q1 shapes up with this metric.
What we can see now is that there is no easing of demand anywhere in the data. This is one reason why we’re projecting another very competitive spring for buyers. Multiple offers and low contingencies. Until we see some of these leading indicators change, that’s the behavior we can expect in the market.
For those of us who want to look “at a glance” to understand supply and demand, Altos has our Market Action Index. When you look at an Altos report, you can see the MAI for any zip code in the country. This is how we take supply and demand and present it in one stat, like a speedometer.
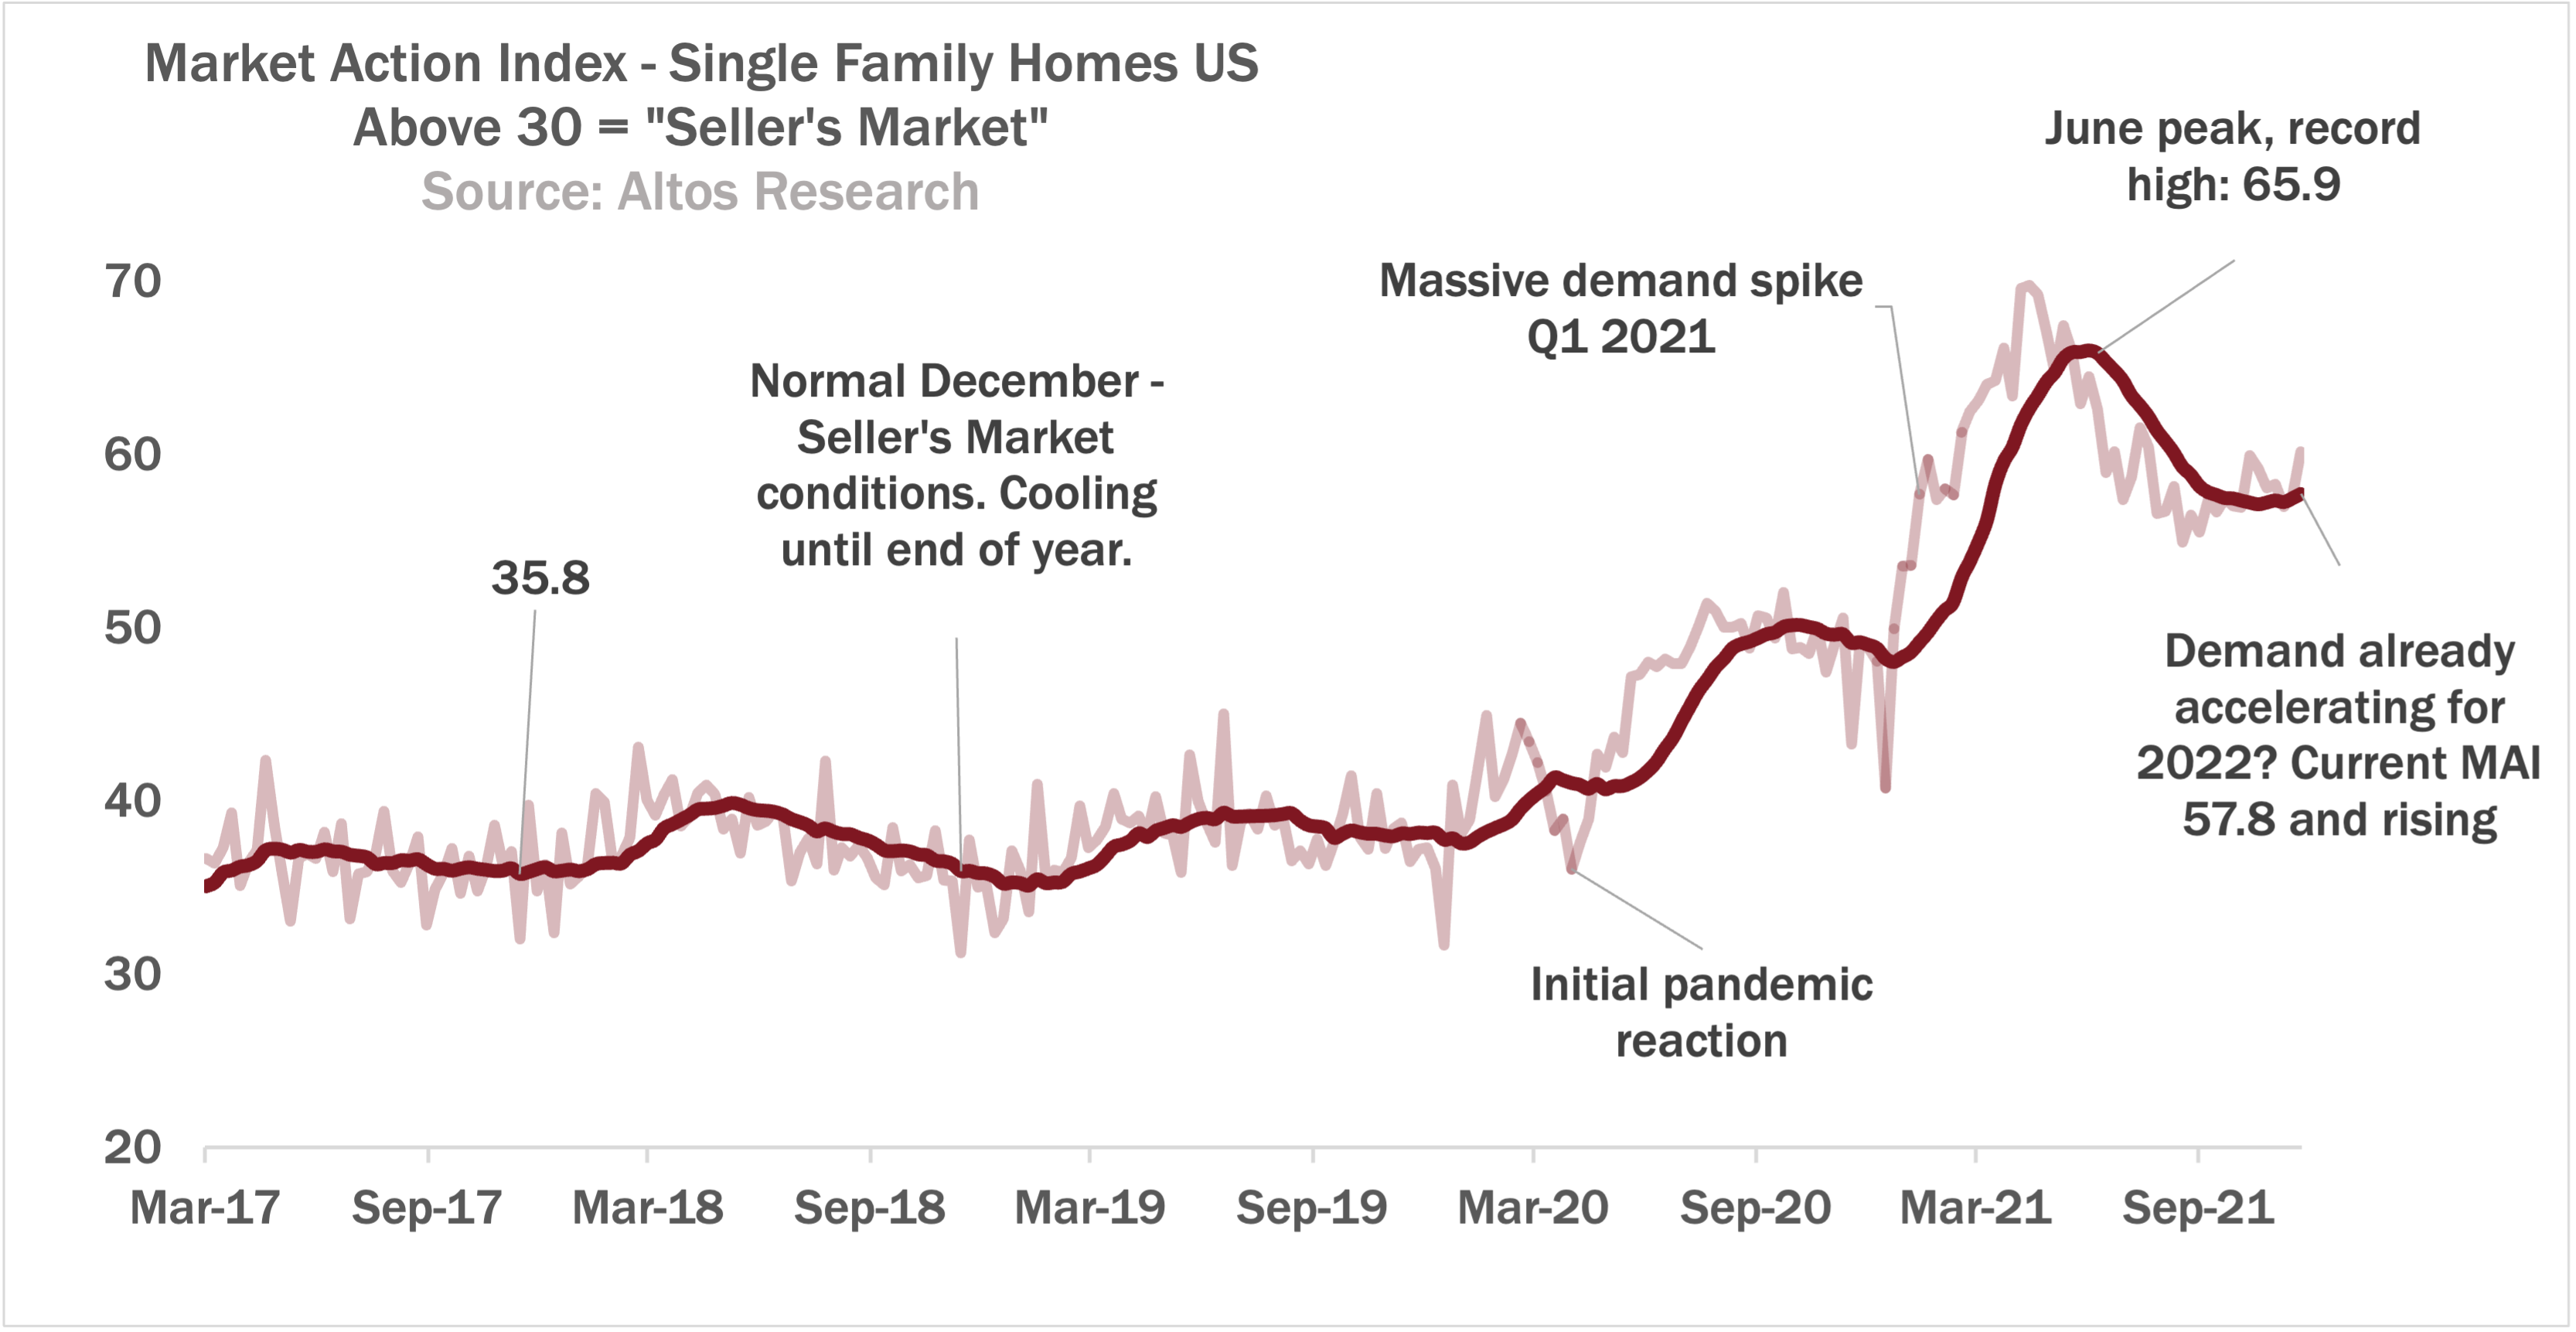
When you look at the MAI chart in your Altos report you can instantly see two characteristics: how strong is the real estate market and is it changing. This week the Market Action Index for the whole US is 58, any reading above 30 means supply is sufficiently tight for current demand levels to be called “Seller’s Market.”
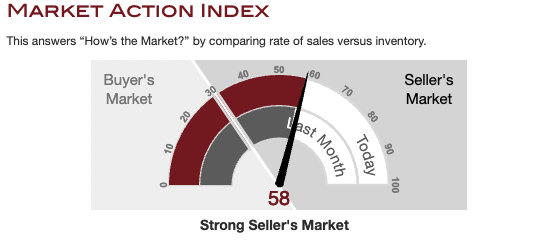
At 58, that means no surprise that inventory is record low and demand super high. We’re in Strong Seller’s Market around the country. What’s interesting here is that the MAI ticked UP from last month - meaning the market seems to be actually heating up before the holidays and before it normally does starting in Q1.
We’ll spend more time with the MAI, and look at the Market Action in some local markets in the Webinar Wednesday but here’s the MAI over time to give you some perspective of how crazy it’s been.
You can see our seasonal peak happened in June this year, as it normally does, it was just way hotter than normal. Then we had our late summer early fall decline, like normal.
And now you can see the light colored line climbing so the smoothed dark line here is starting to curve up before the holidays. Just one more data point on a market that is showing no signs yet of backing down. Lots more to cover with the MAI in the webinar Wednesday.
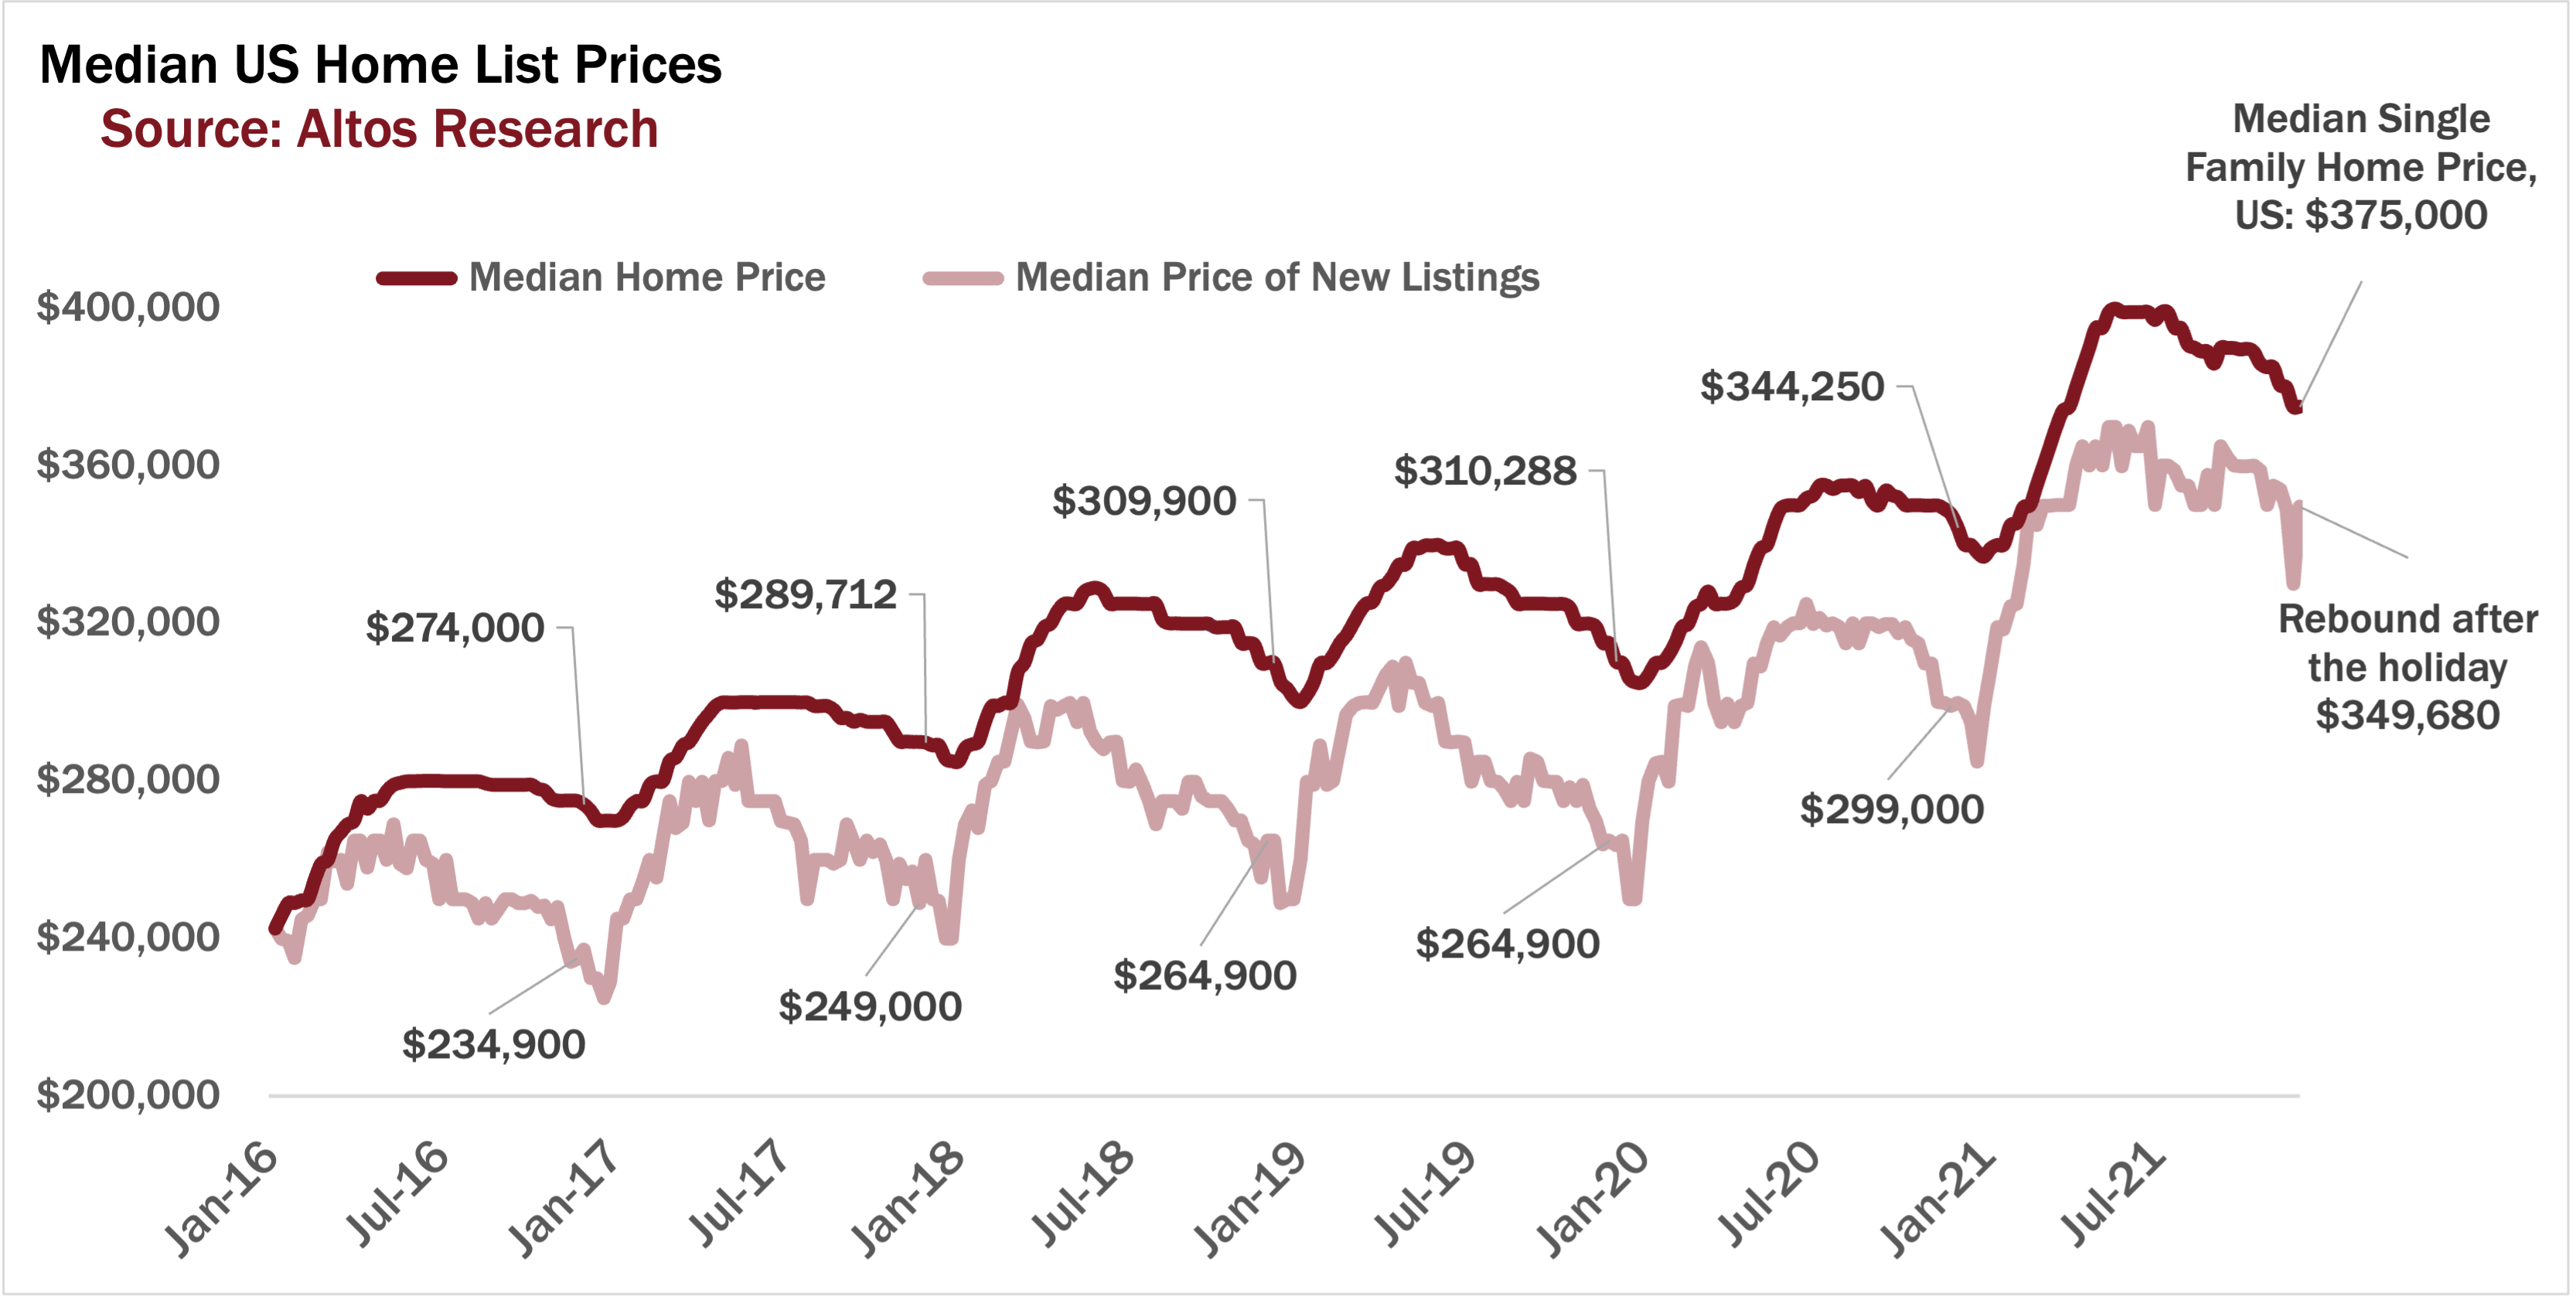
Finally this week home prices. The median price of a single family home in the US is unchanged this week at $375,000. Prices have ticked off their peak, as we always have some seasonal patterns, but are still about 10% higher than last year at this time.
The median price of the newly listed cohort rebounded this week after the holiday to just under $350,000, that’s the light colored line here. We have one more week here before you see the Christmas and New Years dips.
Then in January this is my favorite metric to watch. The price of the new listings. The light colored line here. This is the price of the cohort of properties that hit the market in the given week. So the steepness of the jump in January and February tells us a ton about where home prices will land for the whole coming year. You can see last spring had this big steep jump immediately after New Years. It’ll be fun to watch how predictive that is for home price changes in 2022.
 You can see so much about next year’s market already in the data. None of it is bearish, as far as I can tell. OK - that’s all the time we have for this week.
If you need to know how the market is set up for 2022, if you have clients or dollars at stake, you should join us on the webinar. Hundreds of your colleagues and competitors are there. Don’t miss it.
And of course to get Altos data and market reports for your local markets, we track every zip code in the country, to get yours, click the link to AltosResearch.com run a report, book time with our team. Don’t get caught off guard. It’s going to be a wild year.