
Mike Simonsen
Mike Simonsen is the founder and president of real estate analytics firm Altos Research, which has provided national and local real estate data to financial institutions, real estate professionals, and investors across the country for more than 15 years. An expert trendspotter, Mike uses Altos data to identify market shifts months before they hit the headlines.
It’s looking like we’ll end 2023 with a few percent more homes on the market than last year. Home prices will be up over last year. And we should also end the year with more homes in contract than last year. That all adds up to positioning 2024 to be a welcome turnaround from one of the slowest sales years in decades.
Let’s look at the US housing market data for the week of December 4th to see what the market signals are telling us.
Every week Altos Research tracks every home for sale in the country. We analyze all the pricing, supply and demand, and all the changes in that data and we make it available to you before you see it in the traditional channels. If you aren’t using Altos market reports with your clients, your buyers and sellers, now might be the time to step up. Go to altosresearch.com and book a free consult with our team. Because everyone is worried about what’s happening right now. They need you to help them see clearly. The data we cover here in these national videos is available for every zip code in the US. Join us to dive in.
I’m Mike Simonsen, I’m the founder of Altos Research. Let’s look at the data for the week of December 4th. Please refer to the video below for all the charts I mention in this transcript!
Inventory
There are 556,000 single family homes on the market unsold. That’s almost 2% fewer than last week, that’s a normal adjustment just after the Thanksgiving holiday. Inventory will keep declining through December into the new year.
Still there are now 1.2% more homes on the market than last year at this time. That gap is widening. It looks like we’ll end the year with 4% more homes on the market than we ended 2022. That’s not a ton, but it reflects how sensitive homebuyers are to the spike in mortgage rates that we had in September and October. Interestingly, to me a little more inventory is one signal that we’ll have more home sales next year. Slightly more sellers means there is room for slightly more sales to happen.
In the inventory chart this week, we’re looking at 8 or 9 years of inventory trends. You can see where supply of homes on the market is now at the right end of the chart and where it has been in recent years. There are still far fewer homes on the market now than in recent years. The supply side of the supply demand equation remains very constrained. They’re more homes available now than during the peak of the frenzy in 2021, and just about the same level of inventory as last year at this time.
But what about next year? Will we see more inventory? Will we see sellers come back? Much of the answer to that question depends on mortgage rates. So I’ve included on the chart the highlight of rising and falling periods for mortgage rates. The red and green shading are periods where mortgage rates rose or fell over time. In periods where mortgage rates are low, that increases demand for homes and decreases holding costs for real estate. When the holding costs are lower, we hold more. We sell fewer. Therefore available inventory decreases. Lower rates mean less inventory.
For most of the last decade mortgage rates were low and falling. As a result available inventory fell each year too. In 2018 mortgage rates rose about 100 basis points, that’s the red zone highlighted. When rates rise, holding costs for real estate is higher so we hold less. As a result, 2019 started with more inventory than previous year. 2020 saw dramatically cheaper mortgage rates and a dramatic decrease in inventory.
Last year had a sharp increase in mortgage rates and that was correlated with a sharp increase in inventory. This year started lower, but finished with rising rates to hit their multi-decade high in October. As a result, inventory rose late into the year. You can see the relationship between the shaded areas of mortgage rates and the inventory line is very clear. Rising rates lead to greater inventory, lower rates lead to less inventory available unsold on the market. So when we’re looking at 2024, the news is that mortgage rates have receded off their peak and have been moving lower. That implies that inventory will respond very soon.
For buyers who are waiting for affordability to improve next year as rates fall, the bad news for them is that they are not alone. Their competition heats up too, and their selection will fall.
Where Is Inventory Up or Down This Year?
Rates were up this fall and inventory rose. But it didn’t rise equally around the country. I thought it’d be interesting to look at where in the country inventory is up over last year and where inventory is down vs. last year. The country has the same number of homes on the market as last year at this time, but some states have a lot more homes and some have fewer. In this map, the darker reds have more inventory compared to last year - that’s mostly the south. Louisiana, Arkansas, and also Florida and Texas. While the far west and the rust best and northeast have a lot less available inventory of unsold homes than at the same time last year.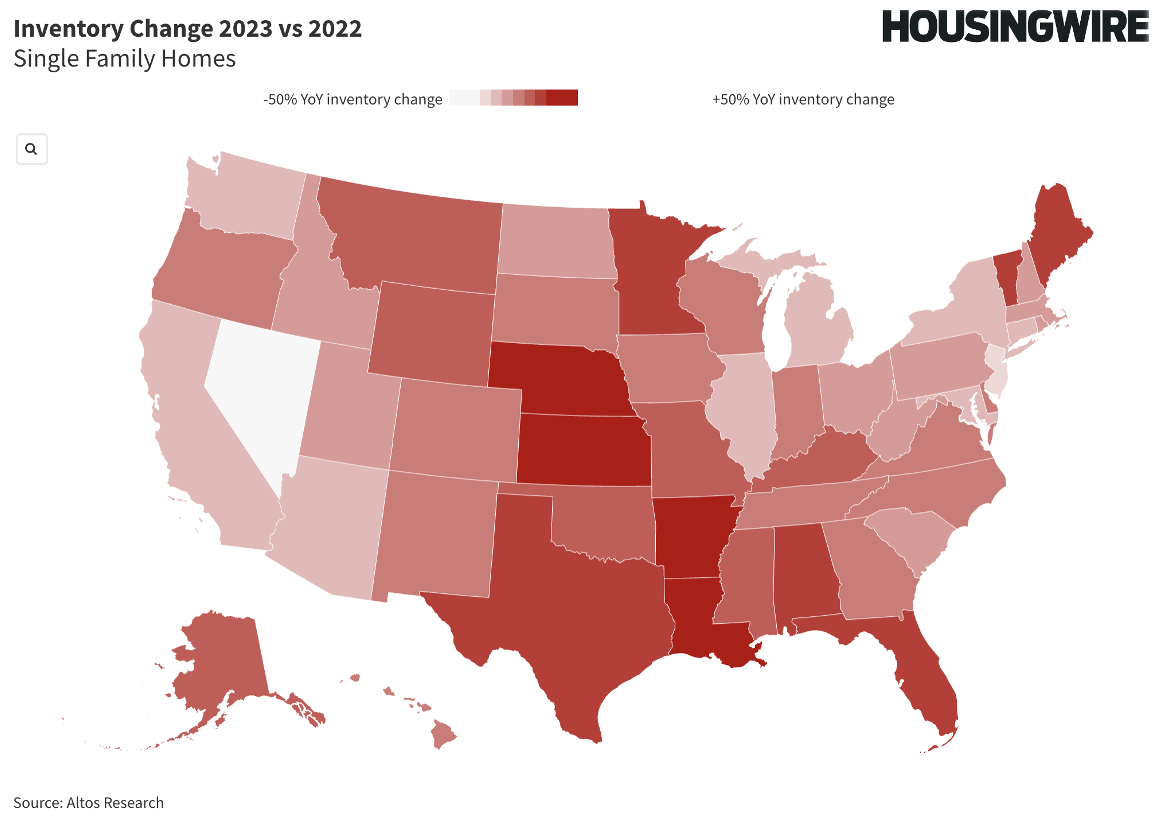
I think it’s quite notable that the western states, especially Nevada, Arizona, Utah all were among the markets that slowed most abruptly last year as rates rose for the first time. This year those states recovered some demand, inventory fell, and prices held up. That is not true of the boom markets in Texas or Florida. I don’t have a precise hypothesis why Phoenix recovered better than Austin this year, but it seems very clear. Las Vegas is usually among the first market to break when things go bad, but this year Vegas was much more resilient than those southern cities. Nevada has a 30% less active inventory than last year at this time.
New Listings & Immediate Sales
The data this week has the last of the holiday activity in it. So new listings volume is way down. Immediate sales were at their lowest level all year. This is normal for the Thanksgiving weekend, so don’t read too much into it. We’ll see a little rebound in this week’s data and then decline weekly through the new year.
Only 33,000 new listings for single family homes, about 5000 of those went into contract immediately. The levels are just about exactly the same as they were last year. We’ve been watching new listings come in each week with slight gains over the same week a year earlier. December is such a seasonal low in real estate that it’ll be interesting to see if these trends continue, but I’m optimistic. We’re watching this chart to see hopefully new listing growing over last year and the immediate sales rate to not contract. That tells us a lot about demand for homes at these prices.
Price Reductions
Price reductions are off their peak now and heading down for the new year cycle. Currently 38.7% of the homes on the market have taken a price cut from the original list price. The fact that the market has more price cuts than is normal is a reflection of affordability. And tells us that demand for homes at these prices isn’t great but it isn’t deteriorating either.
Mortgage rates have been falling for a few weeks, pretty quickly. The same pattern happened last year. If you follow last year’s bright red line to the right end of the chart where the year ended and we had a lot of price reductions, and then pick up this year’s dark red curve at the left side, you’ll see how steeply the price reductions were falling to start 2023. That was an early indicator this year that home sales prices were going to hold up. We knew by January that there were more buyers than sellers. When reading that data in January and February this year a lot of people were incredulous. But we could see the immediate demand pickup in this chart. So pay attention to this line in January.
Here’s how you use price reductions as a leading indicator: Homes are on the market, when a mortgage rate spike cools demand, fewer offers are made and more sellers who were expecting offers that don’t materialize, they have to cut their prices. This happens immediately. So we can see very quickly in this price cuts data where home sales will happen in the future. House is on the market now, takes a price cut in December, gets an offer in January, for a sale that closes in February.
So over the next 8 weeks or so we’ll be watching how steeply the price reductions chart falls in 2024. That’ll give us leading indicators for home price performance for the whole year. Just like it did this year. Mortgage rates have been falling. If they continue to fall into the first quarter, maybe approach 6%, I expect we’ll see similar behavior. If on the other hand, rates bounce back in the 7s, we’ll see less steeply adjusting price cuts. If they rise over 8% again, I suspect that will freeze the housing market, price cuts will jump early and that would be very bearish for sales prices for the rest of 2024.
Home Prices
As of right now, the signals are for continued support for home prices at these levels. There’s nothing in the data now that indicates downward pressure on home prices in 2024. It would take a spike in mortgage rates or some other shock to move the data in that direction.
The median price for single family homes in the US is $425,000 this week. That’s unchanged from last week and a couple percent above last year at this time.
The median price of the newly listed cohort this week is $372,400, that’s down a fraction from last week. There’s always a price dip for homes listed over the holiday week so that’s normal. It is notable that the price of the new listings is 6.5% higher than last year, which is the biggest price leap all year. Don’t read too much into that. The holiday week data can be noisy. But it’s notable that homes are not getting priced the other direction. Each week homes are priced a little bit above where they were last year. That trend will continue into the new year.
Want to get these kinds of market insights for your local market, to help your buyers and sellers get an edge? Go to AltosResearch.com and book time with our team to learn how to interpret the market signals for the people who need it most right now. They need you to be the expert for them.
You can also run a free Altos real estate market report for any zip code in the U.S. and receive an update on that area in your inbox every week.
And, if you want to learn how to read and interpret all the stats in the report, I encourage you to download our free eBook: "How to Use Market Data to Build Your Real Estate Business."
See you next week!