Mike Simonsen
Mike Simonsen is the founder and president of real estate analytics firm Altos Research, which has provided national and local real estate data to financial institutions, real estate professionals, and investors across the country for more than 15 years. An expert trendspotter, Mike uses Altos data to identify market shifts months before they hit the headlines.
Available inventory of homes for sale in the US rose quickly again this week even during the holiday week. Maybe that’s partially due to the holiday falling on a Monday other than a Thursday or Friday, but I suspect it has more to do with sellers watching housing market conditions change quickly and rushing to be ahead of that curve. Inventory continues to grow very substantially each week.
It’s tricky to communicate about this market right now. The headline of the last couple months has been this abrupt change from record low inventory to a rapidly normalizing market. I have people reaching out saying I’m being too alarmist.
Much of this change is normal. We still have far fewer than normal homes on the market almost everywhere in the country. Those tight inventory conditions still indicate a market where sellers generally have pricing power. On the other hand, this shift is real, it’s pronounced, and sellers have significantly less pricing power than they did even six weeks ago.
We have a rapidly changing market, it’s not catastrophically bad, but it’s very very much different than it has been recently. That’s the needle we’re trying to thread each week. There’s no evidence that we’ll have excess inventory on the market any time soon. There’s no evidence of forced selling. But there is a new rush and you can see sellers trying to get out before the market cools faster. So let’s look at the data.
Every week Altos Research tracks every home for sale in the country. We analyze all the pricing, supply and demand, and all the changes in that data and we make it available to you before you see it in the traditional channels. If you aren’t using Altos market reports with your clients, your buyers and sellers, now might be the time to step up. Go to AltosResearch.com and book a free consult with our team. Because everyone is worried about what’s happening right now. They need you to help them see clearly.
I’m Mike Simonsen, I’m the CEO of Altos Research. Here’s what we’re looking at for the week of July 11 2022.
Median Price of Homes
The median price of homes on the market ticked down 1% this week to $450,000. Prices have likely peaked for the year and it might be two years before we see this record high price again. We don’t expect measurable home price gains for the US next year. One way to think about home price appreciation for next year is to use year over year inventory changes right now. Since we have 31% more inventory than last year at this time when we were at record lows, you can see how the supply and demand ratio is unlikely to support big gains in home prices from here. Expect 2023 to have no price appreciation.
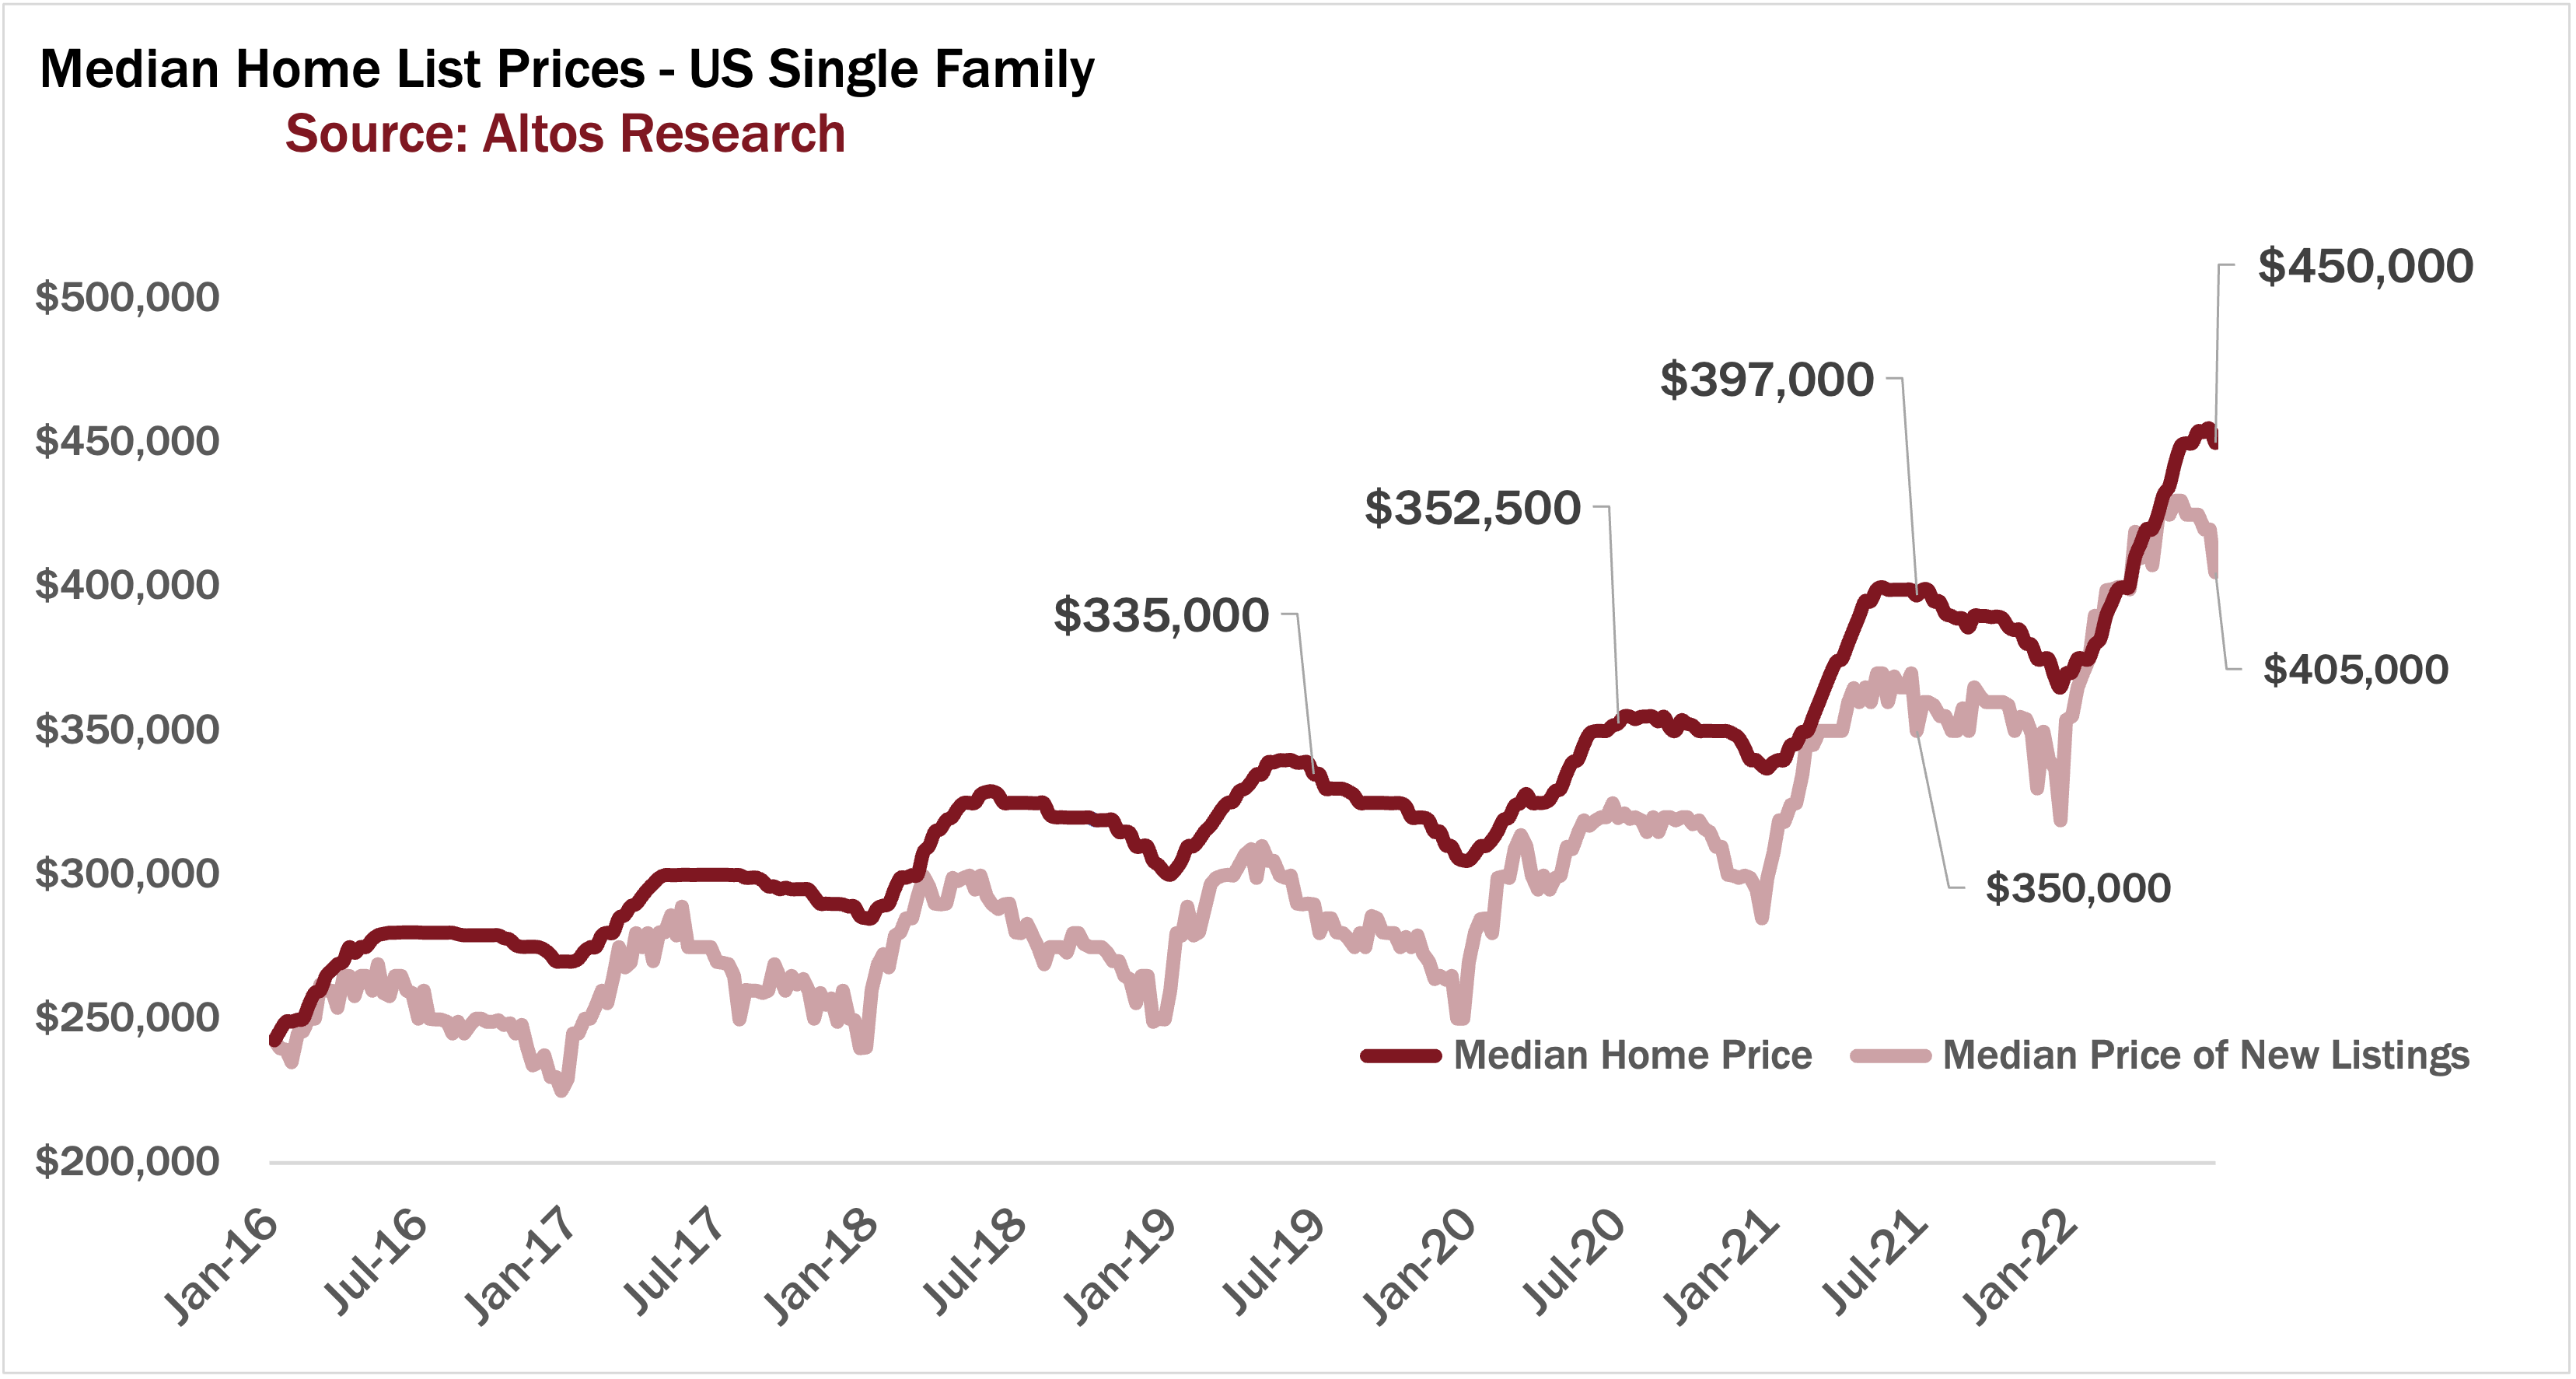
The median price of the new listings dropped pretty sharply this week to $405,000. Now this partially a function of the holiday, but it is also something worth watching. Last year was a similar sized drop in the price of new listings from $369 to $350 this week. That’s the light colored line here. We’ll watch this light colored line next week too. If it were to have another big adjustment down, that’d be a real signal for where these new listings are adjusting for a new normal level of lighter demand. Keep your eyes on that.
Housing Inventory
Inventory gained 3.25 percent in the holiday week. We now have 491,000 single family homes on the market unsold. Available inventory is 31% higher than last year at this time when we only had 373,000 homes on the market. Active inventory is still only half what it was in 2019. This is why it’s hard to forecast catastrophe for US home prices. There are always people who need to buy homes and there’s simply still not that much for sale.
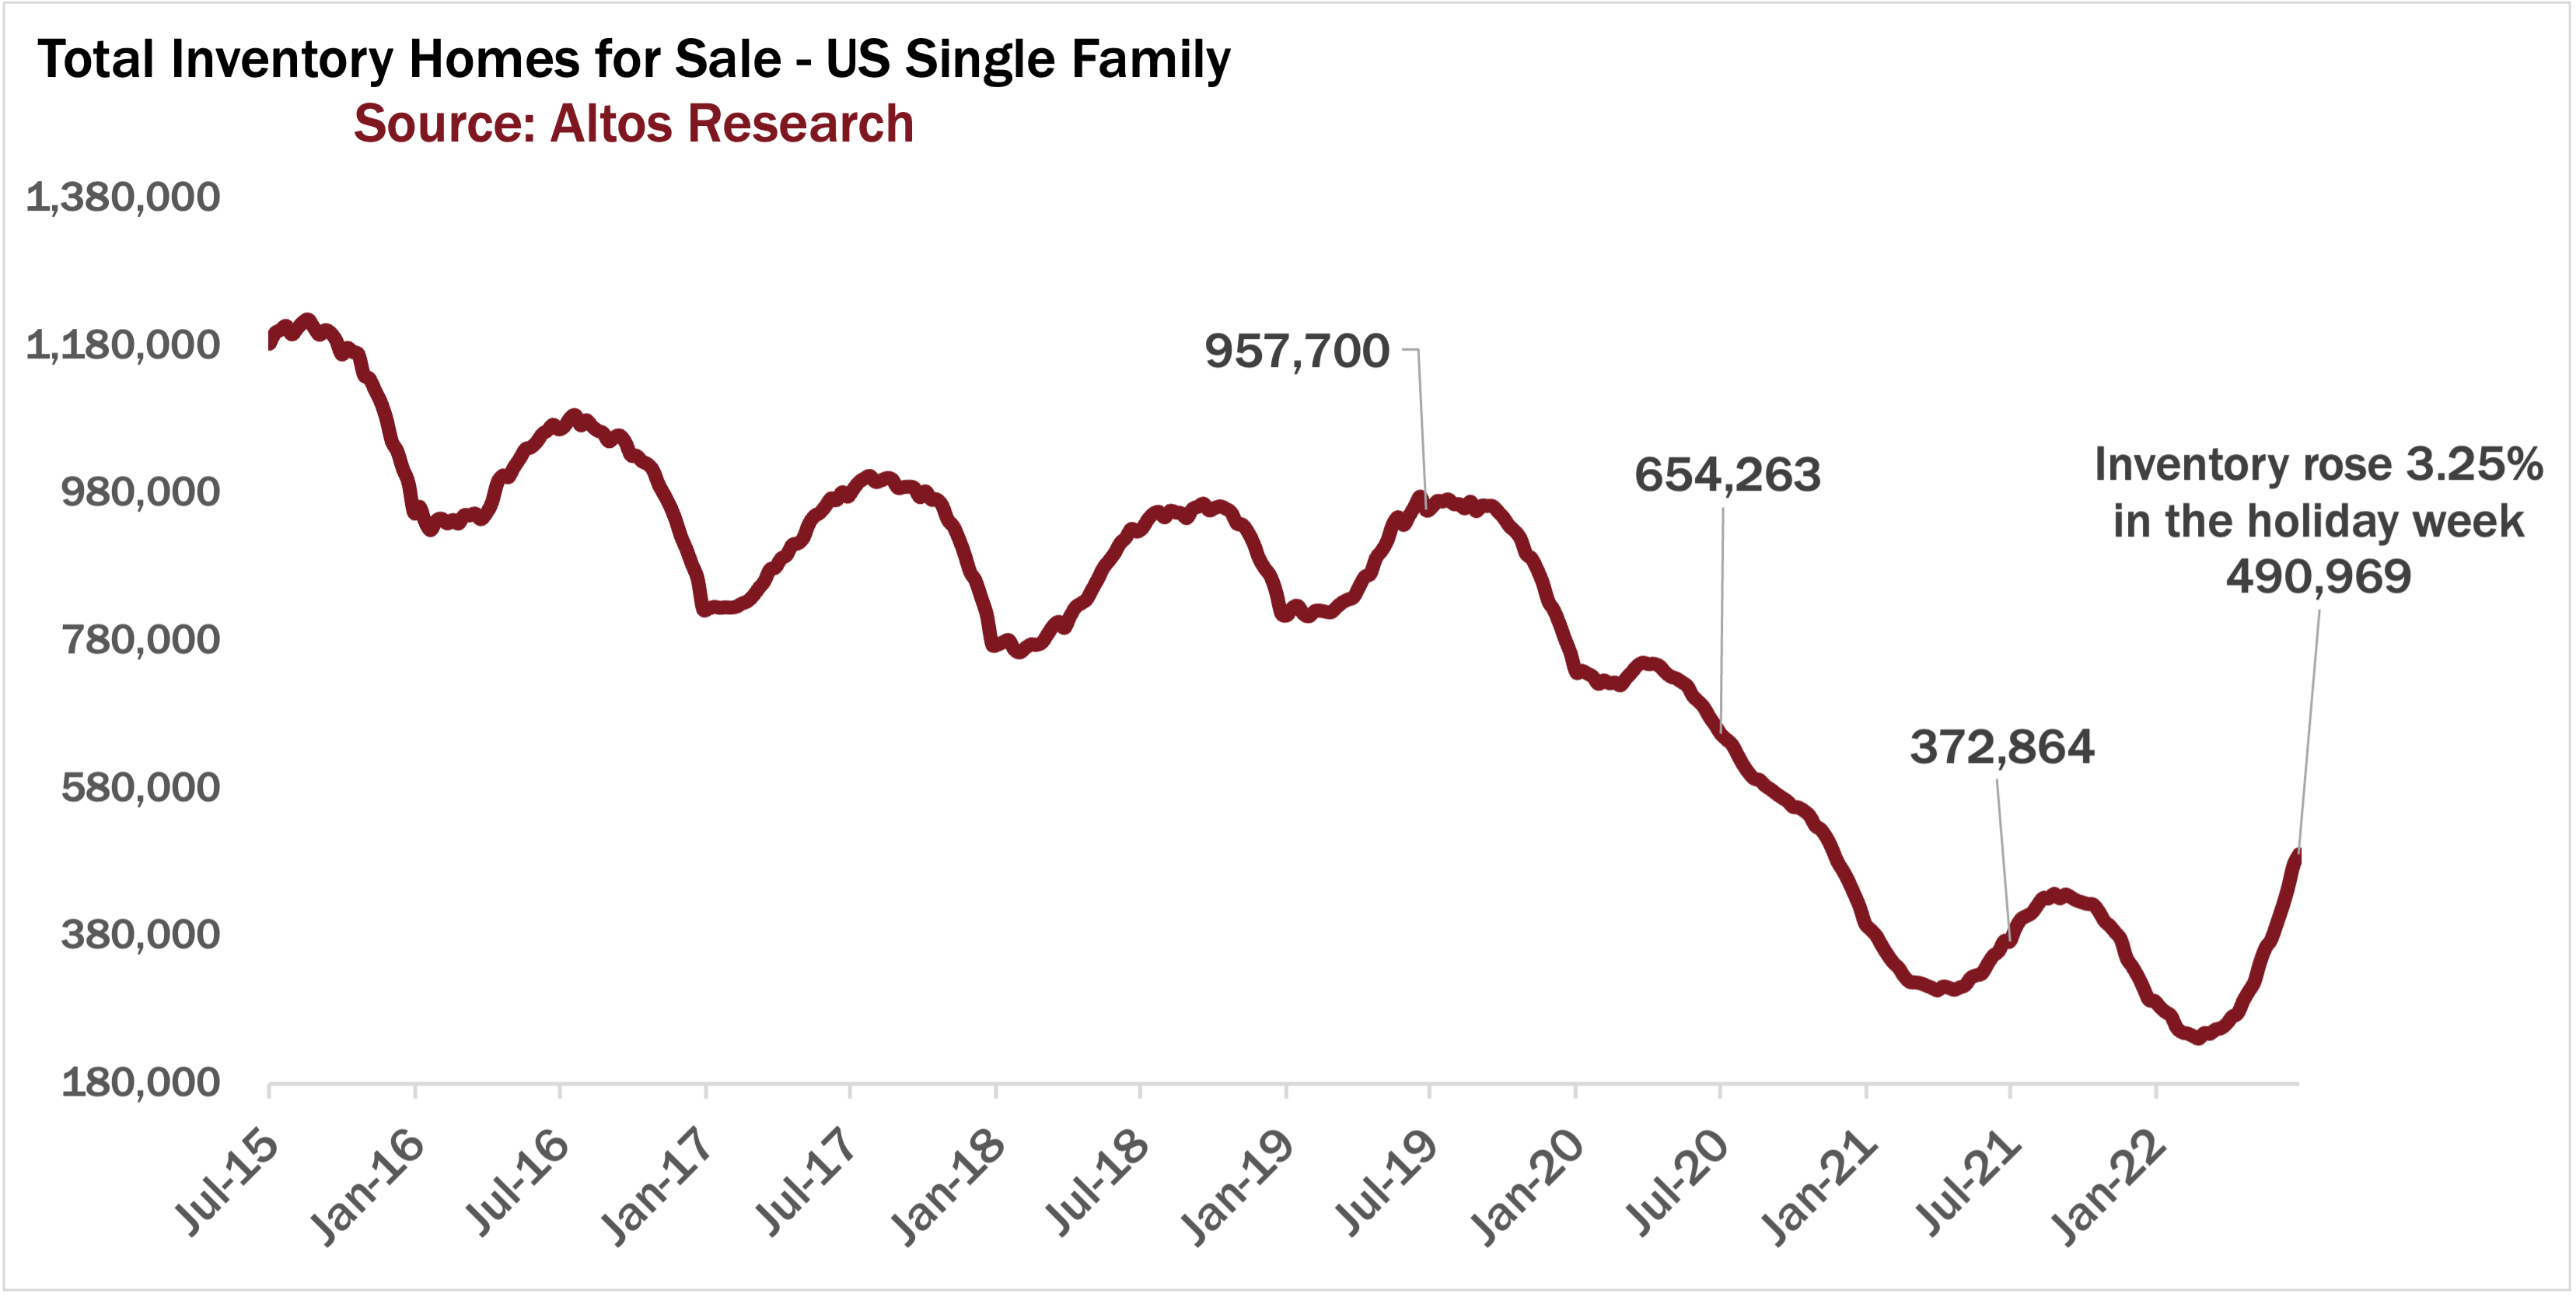
On the other hand, Inventory is usually flat or even down (fewer) over the July 4th holiday, and this week also typically marks the inflection point in the season. Inventory growth slows dramatically from here, in most years. Using the models based on recent years, we should expect one more pretty big week of inventory gains when we report next Monday. Then a gradual flattening of the curve as we get into late summer.
You can see the steep upslope of the inventory curve though at the far right end of the chart has not turned the corner yet. The number of homes on the market available for buyers is increasing pretty markedly each week. And we have at least one more week of that. Then two, three weeks from now will be a good time to revisit the inventory projections for the year to see if that curve has happened or if we have new dynamics to include in the model.
New Listings
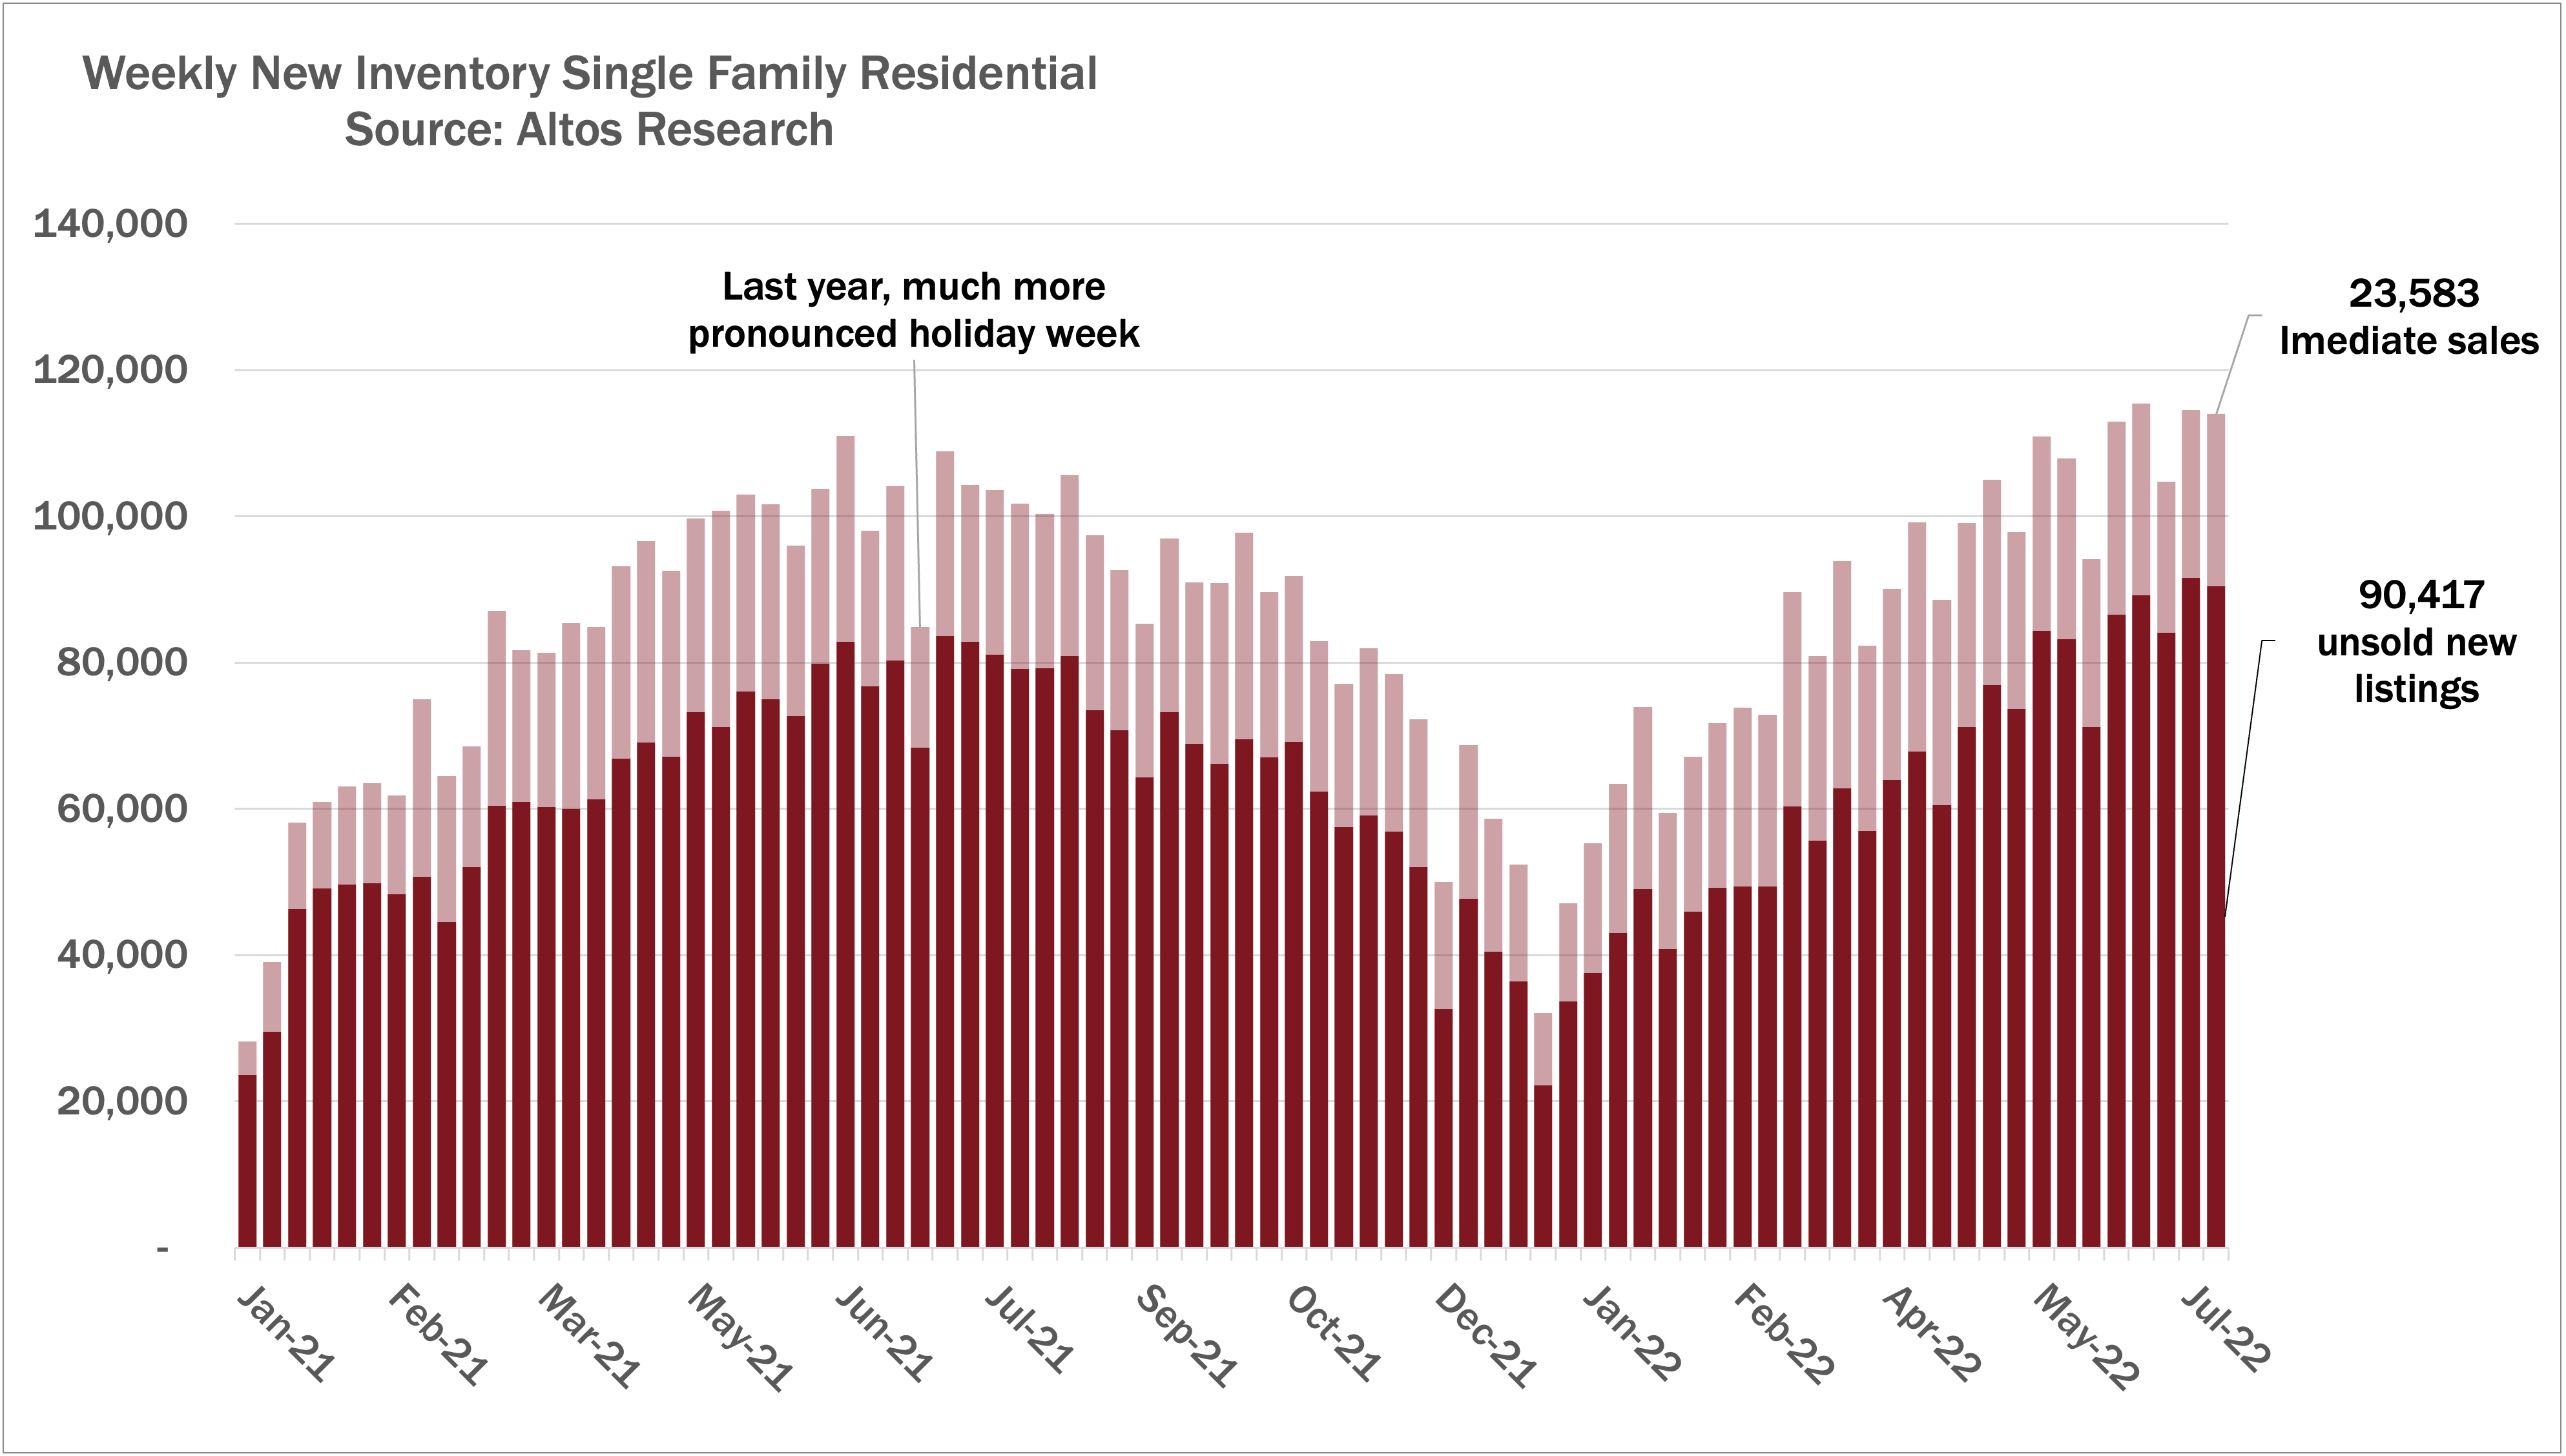
Here’s one way to see how the changing market conditions are pulling new supply on. You can see how anyone who was considering selling this year, may be hurrying get listed sooner. This is our new listings per week. These are the homes that got listed and weren’t immediate sales. That is, they stayed on the market for at least a few days. At 90,000 new listings this week, that’s higher than recent years, and it’s especially notable on the July 4 holiday week.
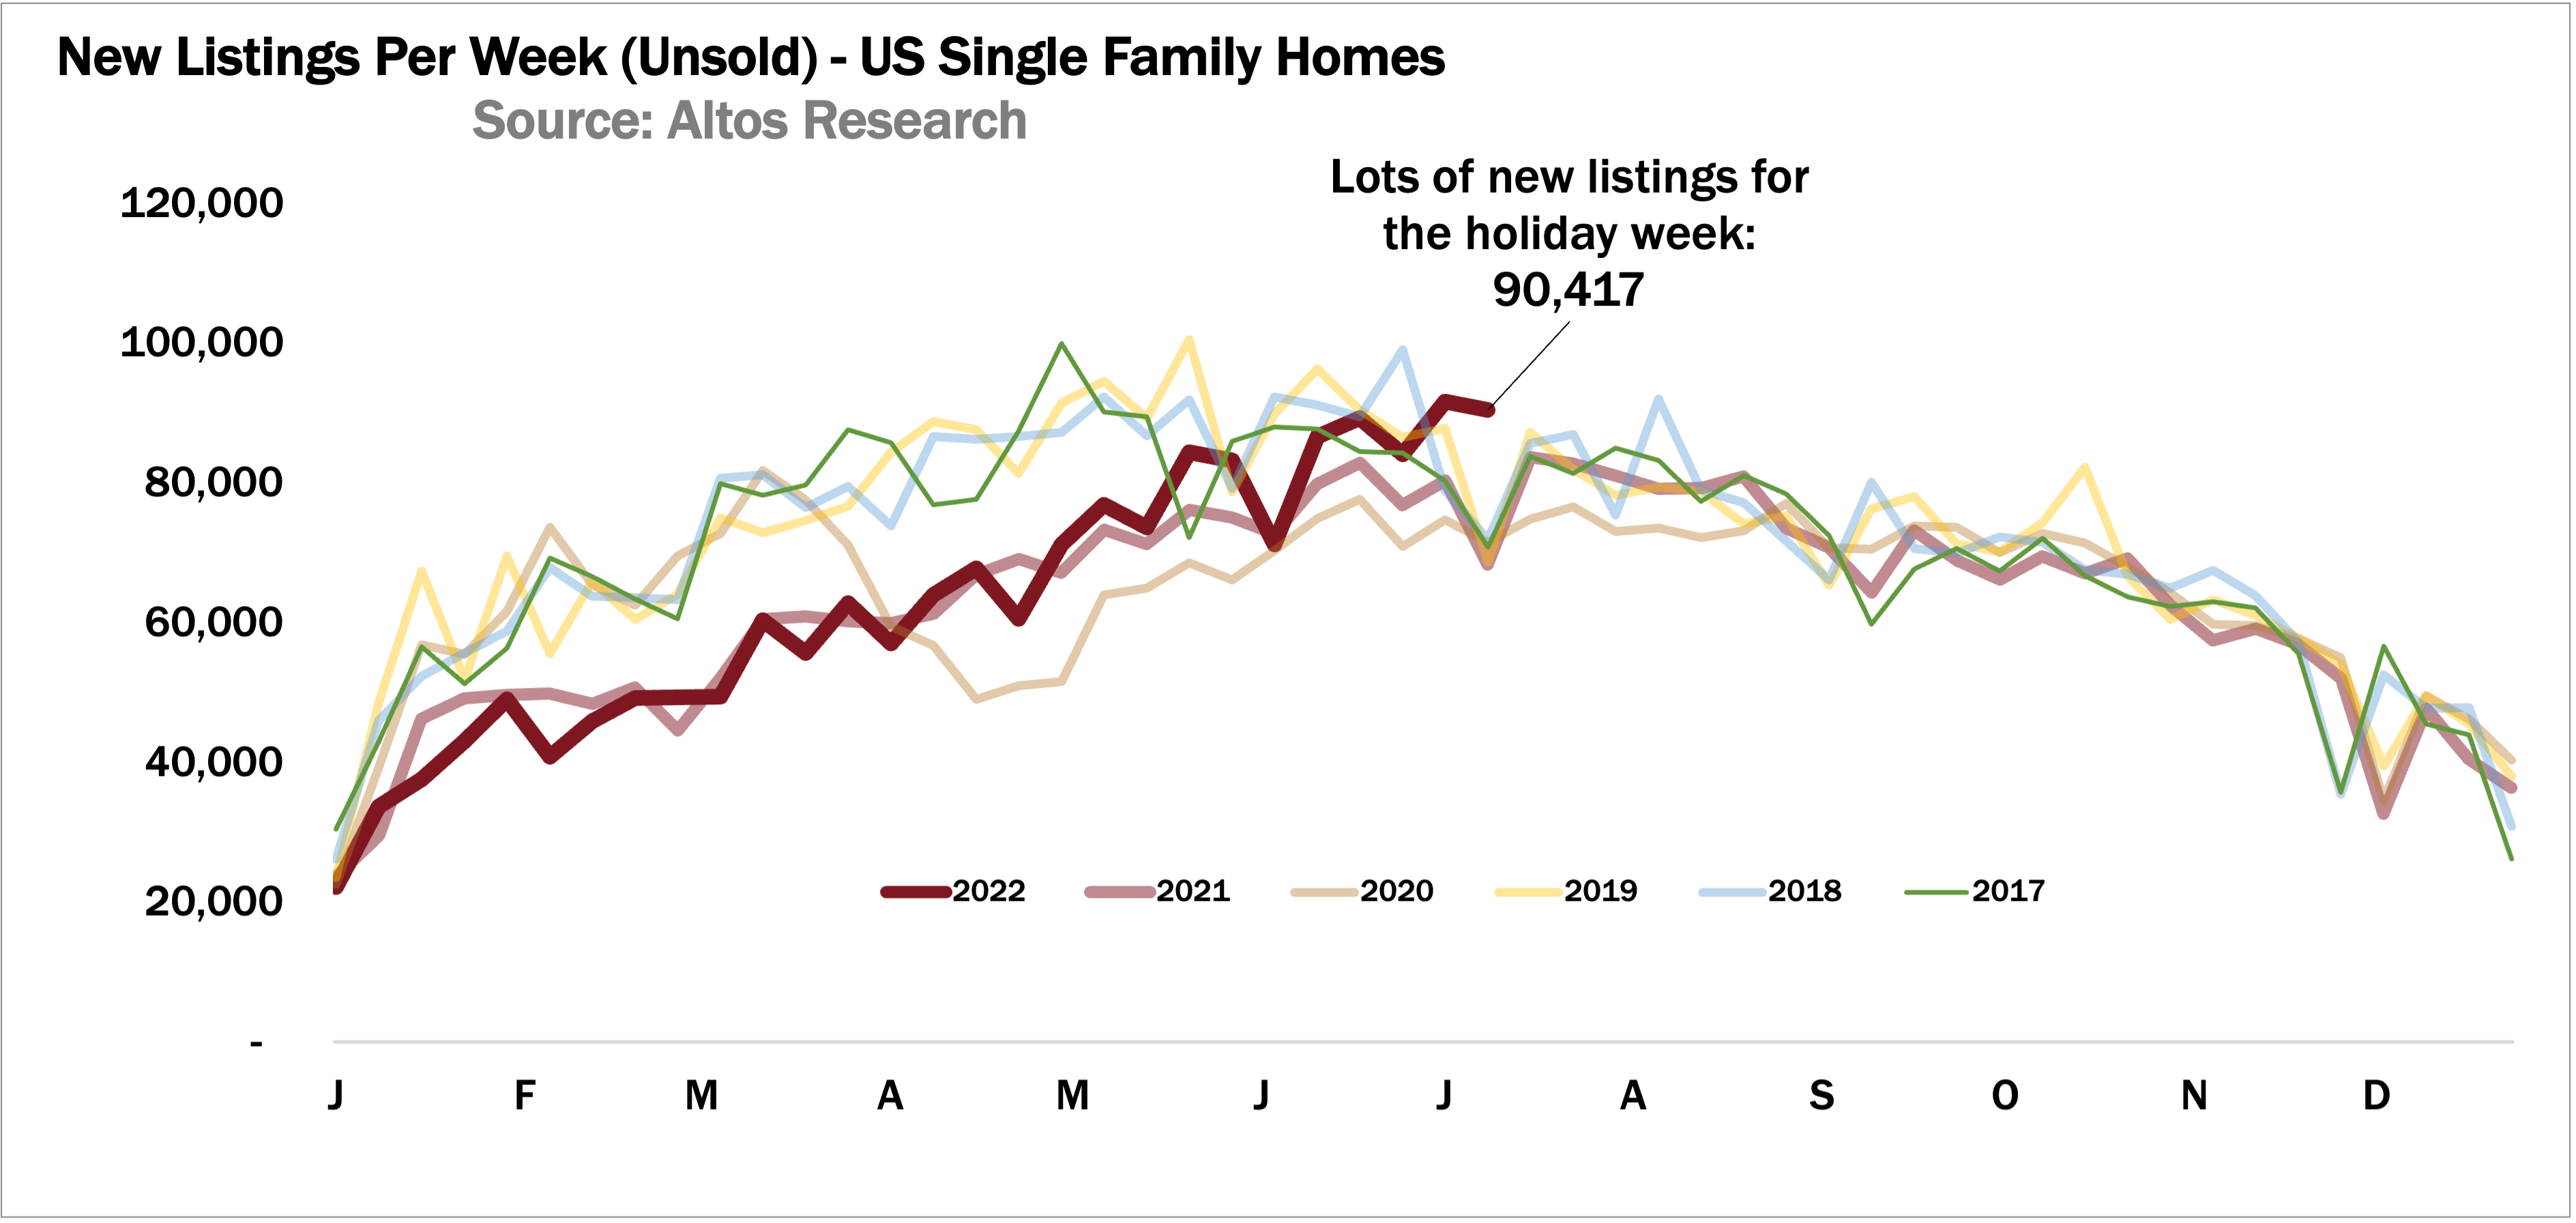
See the dark red line started the year very low, with few new listings and lots of those immediate sales. But in recent weeks, new listings are coming on the market faster than in any recent year. See how all the previous years dip for July 4th? That seems notable. I’ve had people point out their local anecdotes that corroborate this holiday listing volume in a few places around the country.
Again, threading the needle between the cooling data and the fact that this is actually quite normal. You can see that while inventory is ticking up, there’s no flood of new listings. It feels like a lot because we’ve had so few recently. But it’s not crazy.
We’ll spend some time with this data and the rest of the leading indicators in this week’s Altos Research Webinar. That’s Thursday July 14 at 10am Pacific. If you are in the challenging place of communicating this very difficult message to home buyers and sellers, we’ll spend a lot of time on what is changing and what is just fine. These are limited to 1000 attendees and we’ve been having way more than that register each month, so reserve your spot right now.
Relistings
As the market changes, it becomes time to focus on a really cool demand indicator. The percent of the active market that has been relisted. They were on the market, maybe went into contract, but when the contract fails, there are no backup offers. And the house gets relisted back on the market. At 1.7% you can see the dark red line for this year, relists are at their highest level of recent years and they’re ticking up every week.
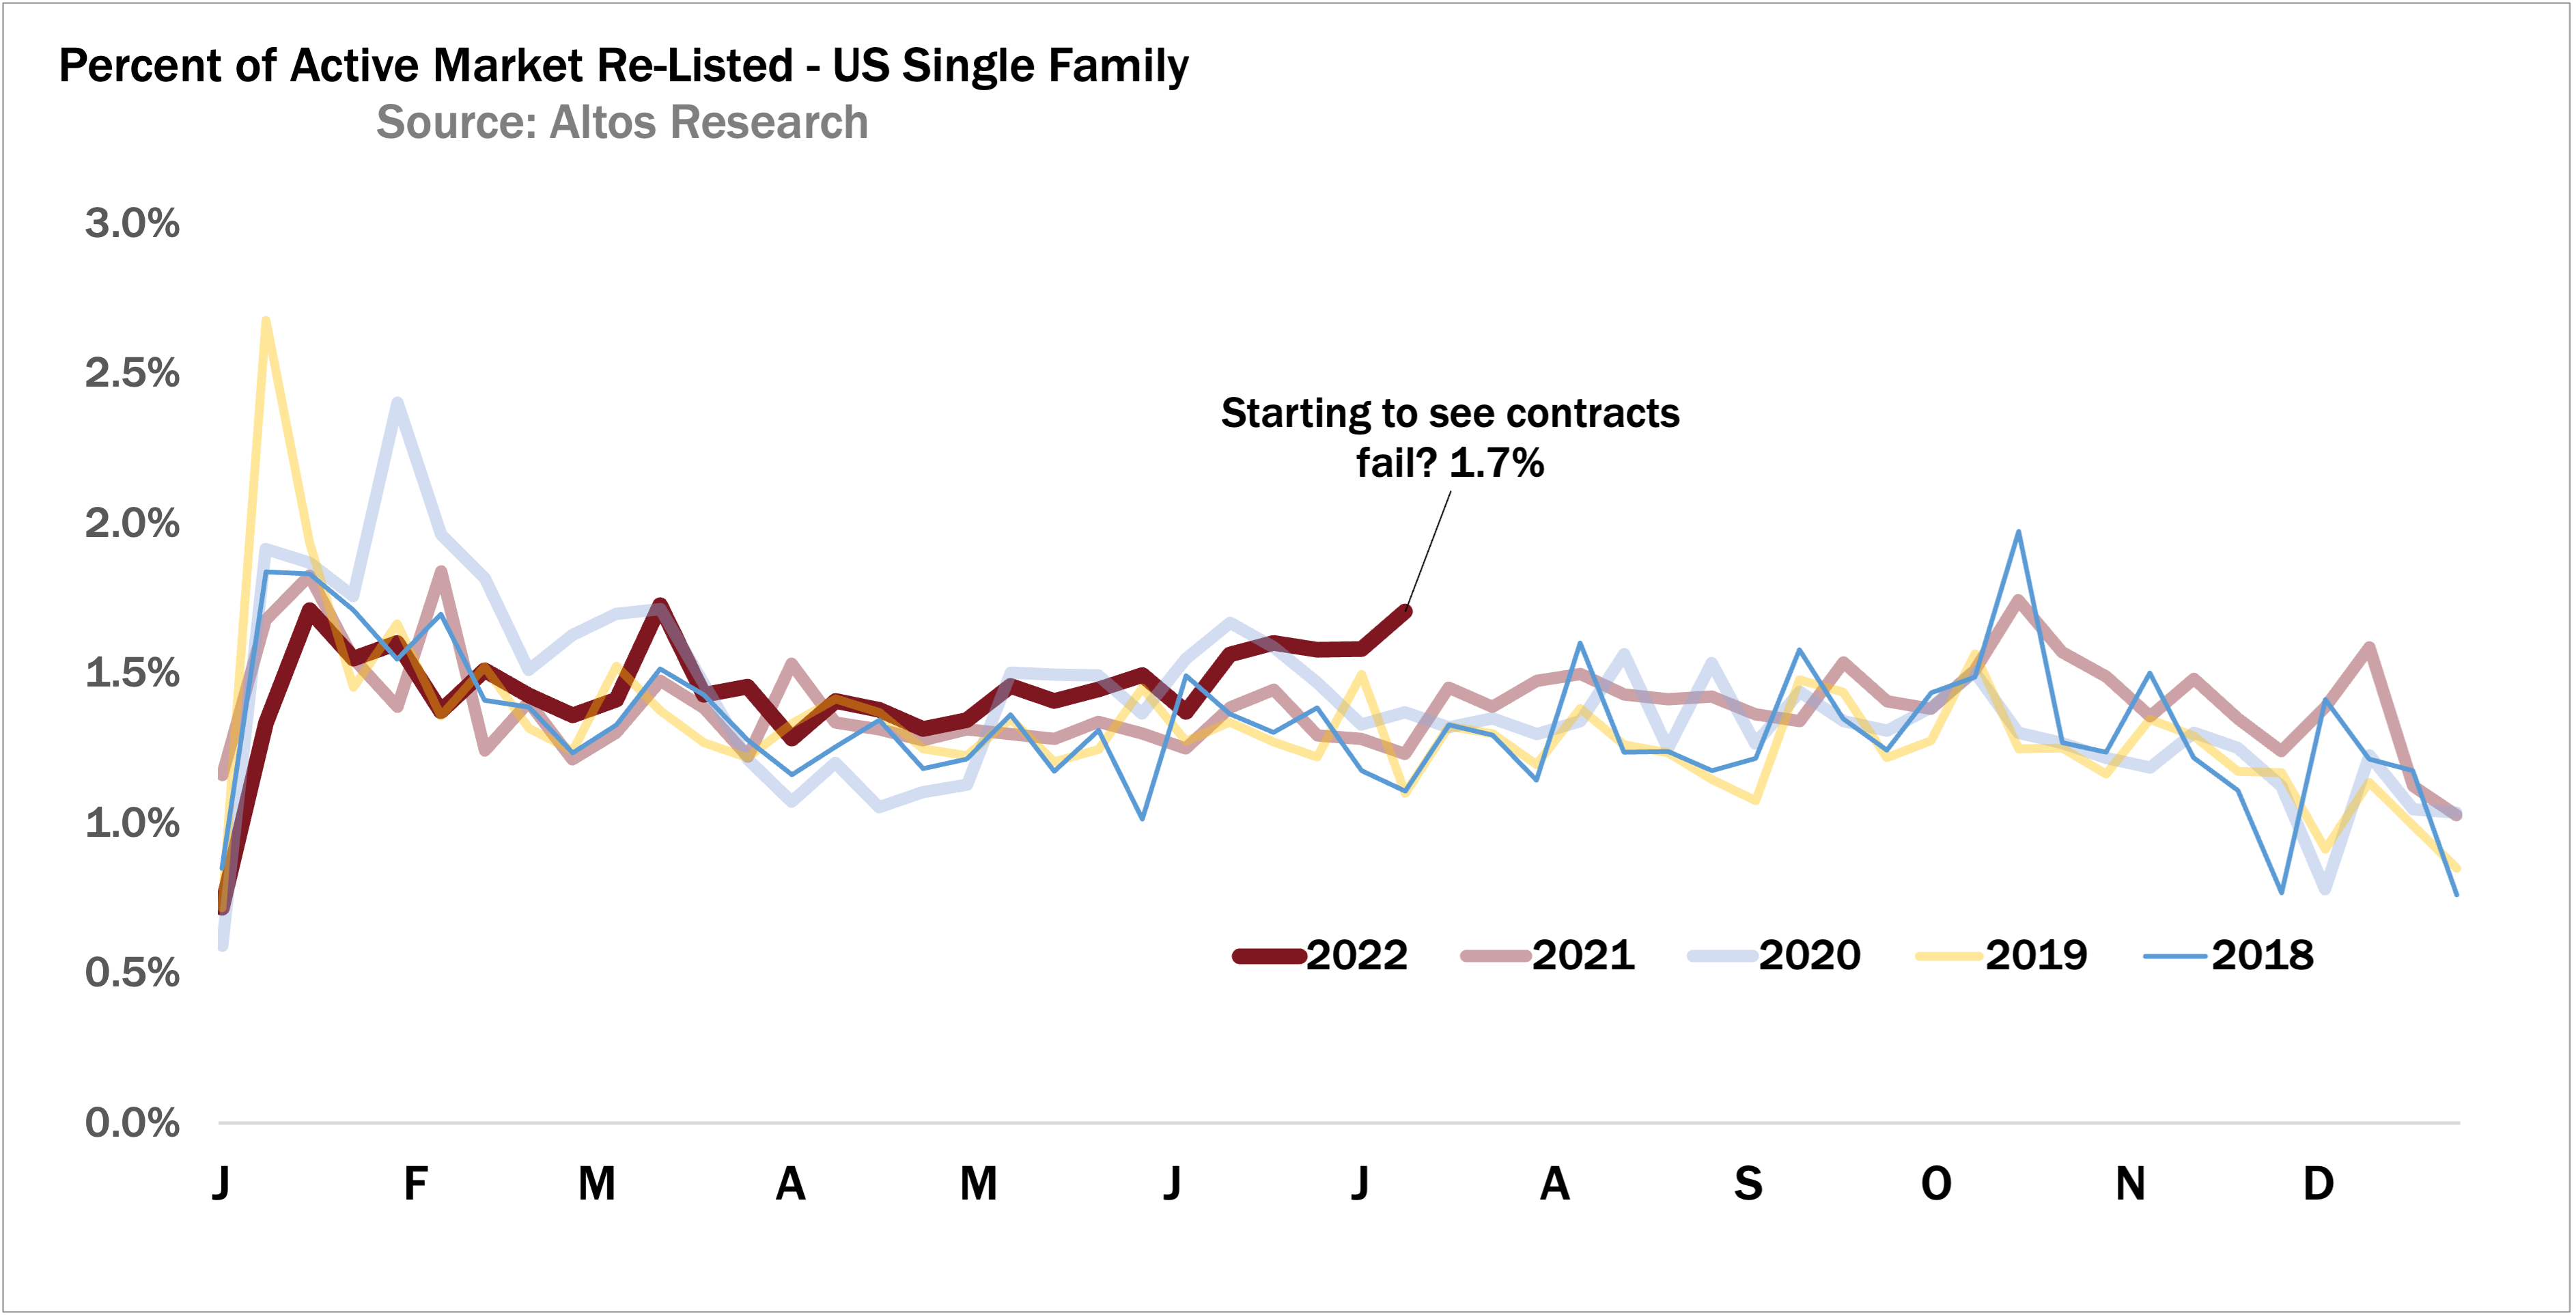
If you go into contract for a few weeks, and the deal falls through, and you have no backup offers, then a house gets relisted. That’s what we’re measuring here. You can see that this week with 1.7% of the active market relisted. See how the dark red line is now consistently higher than previous years and ticked up this week? That’s what we’re watching.
I should note that this is a pretty subtle change. When we fist started Altos Research in 2006, we could see the demand for homes in Silicon Valley start to change dramatically to a point where like 30% of the listings had been relisted. At the time relisting was a marketing tactic. If a house sat on the market for 30 days, people started to wonder what was wrong. So agents would pull the property from the market, and re-list it to get all the “new listings” marketing push. What this teaches us is that rapidly rising relists is indeed a bearish signal. This number right now is ticking up, but isn’t panicky, but it is a notable little rise. And we’re going to keep watching it.
Immediate Sales
We still see some high demand parts of the country and immediate sales still happening. These markets are the opposite of the ones that have been the most hot over the past few years. Most notably this week in the immediate sales chart is that we did not have a holiday drop in those new listings. I already showed you that. The dark part of the each bar here is the week’s new listings that didn’t sell immediately. At the far right end of the chart you can see there was no holiday dip. As I pointed out before, we can see this new supply probably being pulled forward by sellers who don’t want to wait.