
Mike Simonsen
Mike Simonsen is the founder and president of real estate analytics firm Altos Research, which has provided national and local real estate data to financial institutions, real estate professionals, and investors across the country for more than 15 years. An expert trendspotter, Mike uses Altos data to identify market shifts months before they hit the headlines.
Looking for an at-a-glance answer to “How’s the market?”? Look no further than Altos’ Market Action Index – our proprietary index that lets you know if it’s a buyer’s or seller’s market, and which way the market is headed.
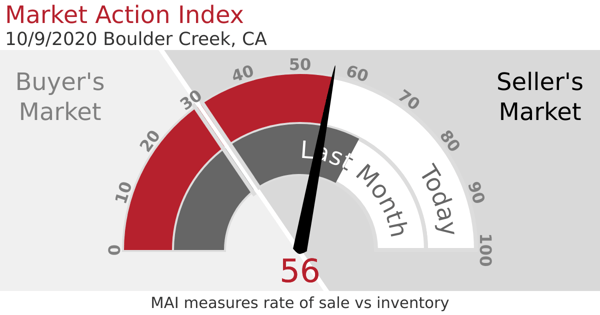
The MAI answers the question “How’s the market?” by comparing the current rate of sales versus inventory plus additional demand metrics. It’s an indicator of supply and demand and overall market competitiveness; i.e. whether it’s a buyer’s or seller’s market, or if the market is heating up or cooling off.
- A MAI of around 30 indicates a balanced market, with just enough supply to meet demand.
- A MAI in the low 20s or below is a buyer’s market, with more supply than demand and prices declining in the future.
- A MAI of 35 or more points to a seller’s market, with demand outpacing supply and prices starting to rise.
- A MAI of 45 or more is a strong seller’s market - inventory is very tight, demand is high, and prices are likely climbing.
Across most markets in the U.S., we typically see the MAI rise in the spring, peak around June 30th, and fall in the second half of the year. Your market dynamics could be different.
See the MAI in action. Click here to run a report for your area.