
Mike Simonsen
Mike Simonsen is the founder and president of real estate analytics firm Altos Research, which has provided national and local real estate data to financial institutions, real estate professionals, and investors across the country for more than 15 years. An expert trendspotter, Mike uses Altos data to identify market shifts months before they hit the headlines.
Inventory is still growing nationally the week before Thanksgiving. That’s very late in the season. Last week it looked like inventory had peaked for the year, which I announced in this video… but it turns out we had another week with more homes hitting the market, driven by more new sellers testing the waters. Sellers have been holding back all year, but maybe now they’re finally starting to relent.
When you dive deeper into the data, you’ll see that while the inventory gains are not isolated to any single market, they are dominated by Florida markets. I’ll share some local details today.
Should we be worried about inventory gains that are this far out of season? Does this mean the long-predicted housing crash is finally upon us? Probably not. One thing greater inventory probably means is more transactions for 2024. And that’s a good thing. More sellers means more sales.
Inventory is growing less restricted, the number of sales is improving, and prices are holding up. These are cautiously optimistic signals for the housing market in 2024.
Let’s look at the US housing market data for the week of November 20th to see what the market signals are telling us.
Every week Altos Research tracks every home for sale in the country. We analyze all the pricing, supply and demand, and all the changes in that data and we make it available to you before you see it in the traditional channels. If you aren’t using Altos market reports with your clients, your buyers and sellers, now might be the time to step up. Go to altosresearch.com and book a free consult with our team. Because everyone is worried about what’s happening right now. They need you to help them see clearly. The data we cover here in these national videos is available for every zip code in the US. Join us to dive in.
I’m Mike Simonsen, I’m the founder of Altos Research. Let’s look at the data for the week of November 20th. Please refer to the video below for all the charts I mention in this transcript!
Inventory
There are now just under 570,000 single family homes unsold on the market. That’s up half a percent from last week. It’s a few thousand more homes on the market across the country this week than last. It’s not a lot, but normally in November inventory is declining each week. So this is an unseasonal gain. Inventory is now a fraction more than last year at this time. The number of unsold homes on the market is still 36% fewer than in 2019 before the pandemic.
So, two ways to read this: one is that sellers are starting to get used to the new normal and the deep drought for home sales is finally starting to turn. That’s the optimistic view for 2024.
Another way to read this is for the housing crash crew: inventory is climbing in November that must mean that sellers are panicking. They’re trying to get out now. Maybe their AirBnB is bust and they have to unload. Maybe their taxes have adjusted higher and they can’t afford the payments. Maybe they’re afraid of the economy.
If you look at the long term trend of homes on the market, it’s obvious our shortage. In 2019 there were 877,000 single family homes on the market compared to 570,000 now. I’ve included the annotations so you can compare inventory over the years. It’s also notable at the far right end of this chart the slow increase of inventory in 2023. It’s not fast gains. Last year the inventory gains were much much faster. The mortgage rate shocks were much more abrupt. This is one of the signals I use to interpret that increasing inventory isn’t a panic scenario, it’s more like normalization. Mortgage rates are higher and generally that leads to greater inventory. More selection for buyers. The market is trying to get back to the balance of earlier in the decade.
Florida Leads Inventory Gains
It’s worthwhile to look at the parts of the country where inventory is growing. It turns out that it’s the Florida markets dominating the list of where inventory is growing. Sarasota, Miami, Tampa are leading the country with more new listings this November.
The Texas markets have more homes on the market now than last year, but the increase this month is much less abrupt than Florida. This is a signal to me that the market is normalizing in Texas. We’re seeing more sellers in Texas and that implies more sales in the coming year. Pending sales are ticking up in Houston and Dallas right now, year over year. That’s another data point to confirm my assumption.
In this table, I have the 50 biggest metros, sorted by the growth in inventory in November. See the Florida markets: Sarasota, Miami, Tampa, Ft. Myers in red at the top. If you look in the Year over year Change column the red cells you’ll see more Texas markets which show about 30% more homes on the market now than last year. And only a small handful, including Austin, San Antonio, and Memphis have more inventory now than in 2019. Most of the country has far fewer homes unsold on the market now than before the pandemic. Inventory remains very restricted.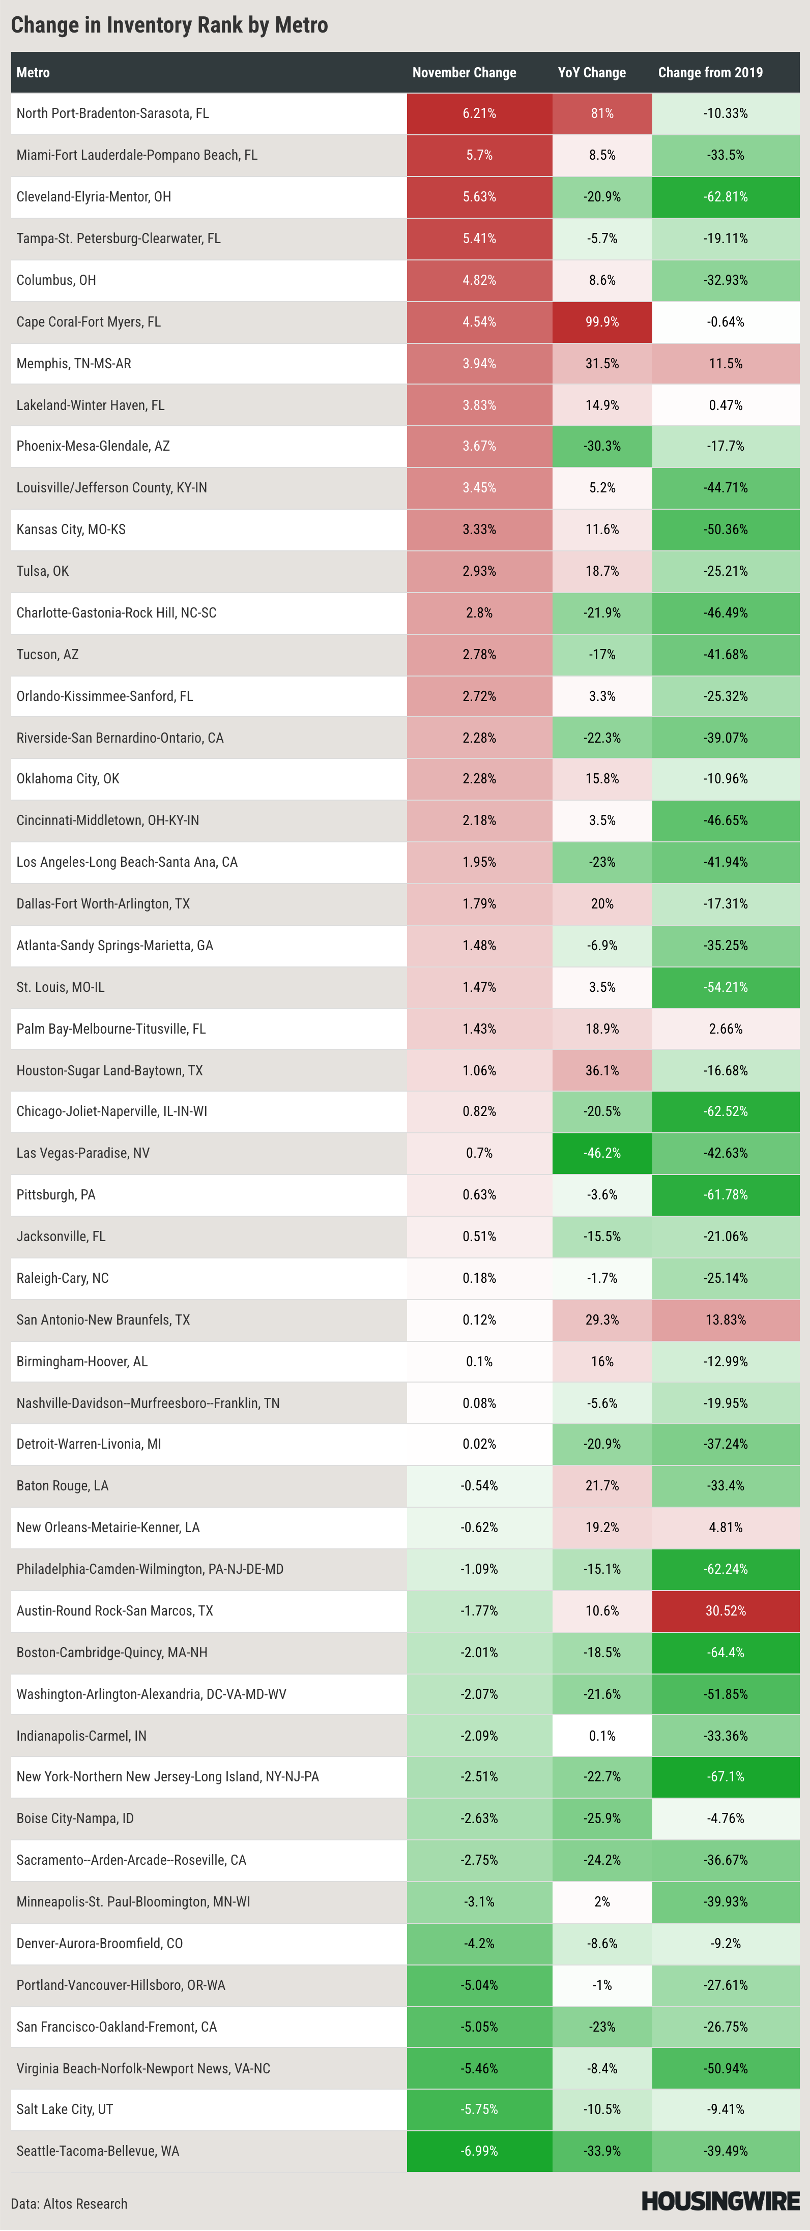
I pulled this data from the Altos Advanced Analytics platform. If you are interested in having this type of insight for your work on the housing market, you should subscribe to Altos Premium for our Advanced Analytics platform. Book a conversation with our team and we’ll get you set up so you can get this data yourself.
New Listings
So inventory is climbing in November. How worried should we be? It is important to keep in mind that new listings are still way fewer than pre-pandemic. There are fewer sellers now each week than normal years. There is no flood of sellers. We’re not anywhere close to a market with a glut of homes for sale. Do not confuse this turn at the bottom of the market with a crash. Hopefully what we’re seeing is the end of this very restricted seller trend of the last 18 months. Maybe it’s finally starting to recover.
I get comments all the time about a housing crash of course. I don’t have a clear view why we would have a flood of sellers. I don’t buy the argument that homeowners are hurting with inflation or the economy and are going to rush to sell suddenly leaving us with a glut of homes on the market. We’re a long way away from those kinds of conditions.
But we finally have slightly more new listings each week than last year. This week 58,000 single family homes hit the market. Of those 9,000 went into contract immediately with buyer offers. There were more immediate sales this week than last year at this time. In this chart each bar is the total count of new sellers each week. The taller the bar the more sellers. Each week now the bars are just finally a bit taller than the year prior. I drew the dotted line horizontally so you can compare to last year at this time. The light portion of each bar are the immediate sales. We’re watching this chart to make sure there’s not some flood of sellers or that the immediate sales don’t shrink to nothing. We want nice robust growth in buyers and sellers. Fingers crossed that’s what the new year brings.
The data so far implies to me that any increase in inventory we get in the market this fall is going to help homebuyers this spring and that 2024 will have more home sales than this year. I’ve mentioned this for a few weeks now. This may be the bottom of the housing recession where we will slowly claw our way back to more normal conditions from here, especially if mortgage rates stay over 7% for the year.
Sales Rate
Here’s how to view the market turning the corner in terms of numbers of home sales. This is a chart of the total number of homes with contracts pending each week. There are only 304,000 single family homes in the pending stage right now. This is still very low. The sales rate has been very low all year long. Demand has been low from homebuyers and also supply has been constrained by sellers. The sales rate started the year with 30% fewer homes in contract. Now there are only 3% fewer. The dark red line is the curve of sales for this year. The bright red is from last year. See how they’re converging now at the right end of the chart? As we’ve shown above there are slightly more sellers this fall, that implies that we’ll have slightly more transactions in the coming months.
If a house gets listed now, it gets an offer in December or January, that’s when it moves from the active listings to the pendings set. Then the sale closes in Q1. The trajectory of improving sales rates looks like before the end of the year we’ll start showing year over year home sales gains.
Remember this is the quantity of transactions happening. The 2023 housing market recession has been marked by very few transactions. And it sure looks to me like we’re at the bottom and starting to round the corner. More sellers mean more sales, so let’s keep watching for these lines to cross. Does it happen before the end of the year? Maybe!
Home Prices
Home prices are the other factor in a housing recession. The industry cares about the number of transactions, consumers care about home prices. And even while the number of transactions fell dramatically in the last 18 months, home prices have not fallen. The median price of single family homes in the US is now $428,000. That’s a couple percent higher now in 2023 than where home prices finished 2022. A couple percent higher. That’s the dark red line on this chart. I’ve annotated the chart so you can compare where the curves were last year at this time.
The median price of the newly listed cohort is $380,000 this week. That’s also higher by a few percent than in 2022. That’s the bright red line on this chart. We can use the price of the new listings to see that while there are slightly more sellers sneaking onto the market now, those sellers are not feeling downward price pressure. It is wise to use the price of the new listings as an early leading indicator for where future home sales prices will land. In aggregate, the sellers and listing agents know exactly where to price homes for them to sell. Any given home may be over or under priced, but in aggregate the sellers’ list prices are very close to the final sales price. So we pay attention to the price of the new listings each week, if for example we’re worried that sellers might be panicking. As of now, we see a few more sellers and no downward pressure in the asking prices. I think that’s very telling. It’s part of the story of the market nearing its transition to be slightly more healthy next year.
If, on the other hand, the increased inventory from this month were accompanied by prices inching lower, that would be a bearish sign. But that’s not what we see.
We have the Thanksgiving week and Christmas New years’ weeks to complete the year. See the two big dips in the bright red line. That’s still to come. It’ll be interesting to see if those end above or below last year’s holidays. This year’s seasonal trend has been less dramatic so I wouldn’t be surprised to see that continue and we’ll finish the year with a couple percent home price gains over 2022.
Want to get these kinds of market insights for your local market, to help your buyers and sellers get an edge? Go to AltosResearch.com and book time with our team to learn how to interpret the market signals for the people who need it most right now. They need you to be the expert for them.
You can also run a free Altos real estate market report for any zip code in the U.S. and receive an update on that area in your inbox every week.
And, if you want to learn how to read and interpret all the stats in the report, I encourage you to download our free eBook: "How to Use Market Data to Build Your Real Estate Business."
See you next week!