
Mike Simonsen
Mike Simonsen is the founder and president of real estate analytics firm Altos Research, which has provided national and local real estate data to financial institutions, real estate professionals, and investors across the country for more than 15 years. An expert trendspotter, Mike uses Altos data to identify market shifts months before they hit the headlines.
Available Inventory of unsold homes on the market is climbing every week, very quickly. Many Americans are still buying homes of course, seemingly undeterred by the trends that those of us who look at the data everyday see very clearly. We’re working hard to chronicle this major market shift for you. To best explain what is slowing and what is not. That’s what these weekly videos are for.
Every week Altos Research tracks every home for sale in the country. We analyze all the pricing, supply and demand, and all the changes in that data and we make it available to you before you see it in the traditional channels.
If you aren’t using Altos market reports with your clients, your buyers and sellers, now might be the time to step up. Go to AltosResearch.com and book a free consult with our team. Because everyone is worried about what’s happening right now. They need you to help them see clearly.
I’m Mike Simonsen, I’m the CEO of Altos Research. Here’s what we’re looking at for the week of June 20 2022.
Inventory
Available inventory of unsold single family homes on the market rose another 5.6% this week to 419,000. We have 18 percent more homes on the market now than last year at this time. By the end of the month we’ll have more homes on the market than we did at the peak all last year. Inventory will continue to grow through at least September this year. Maybe into October.
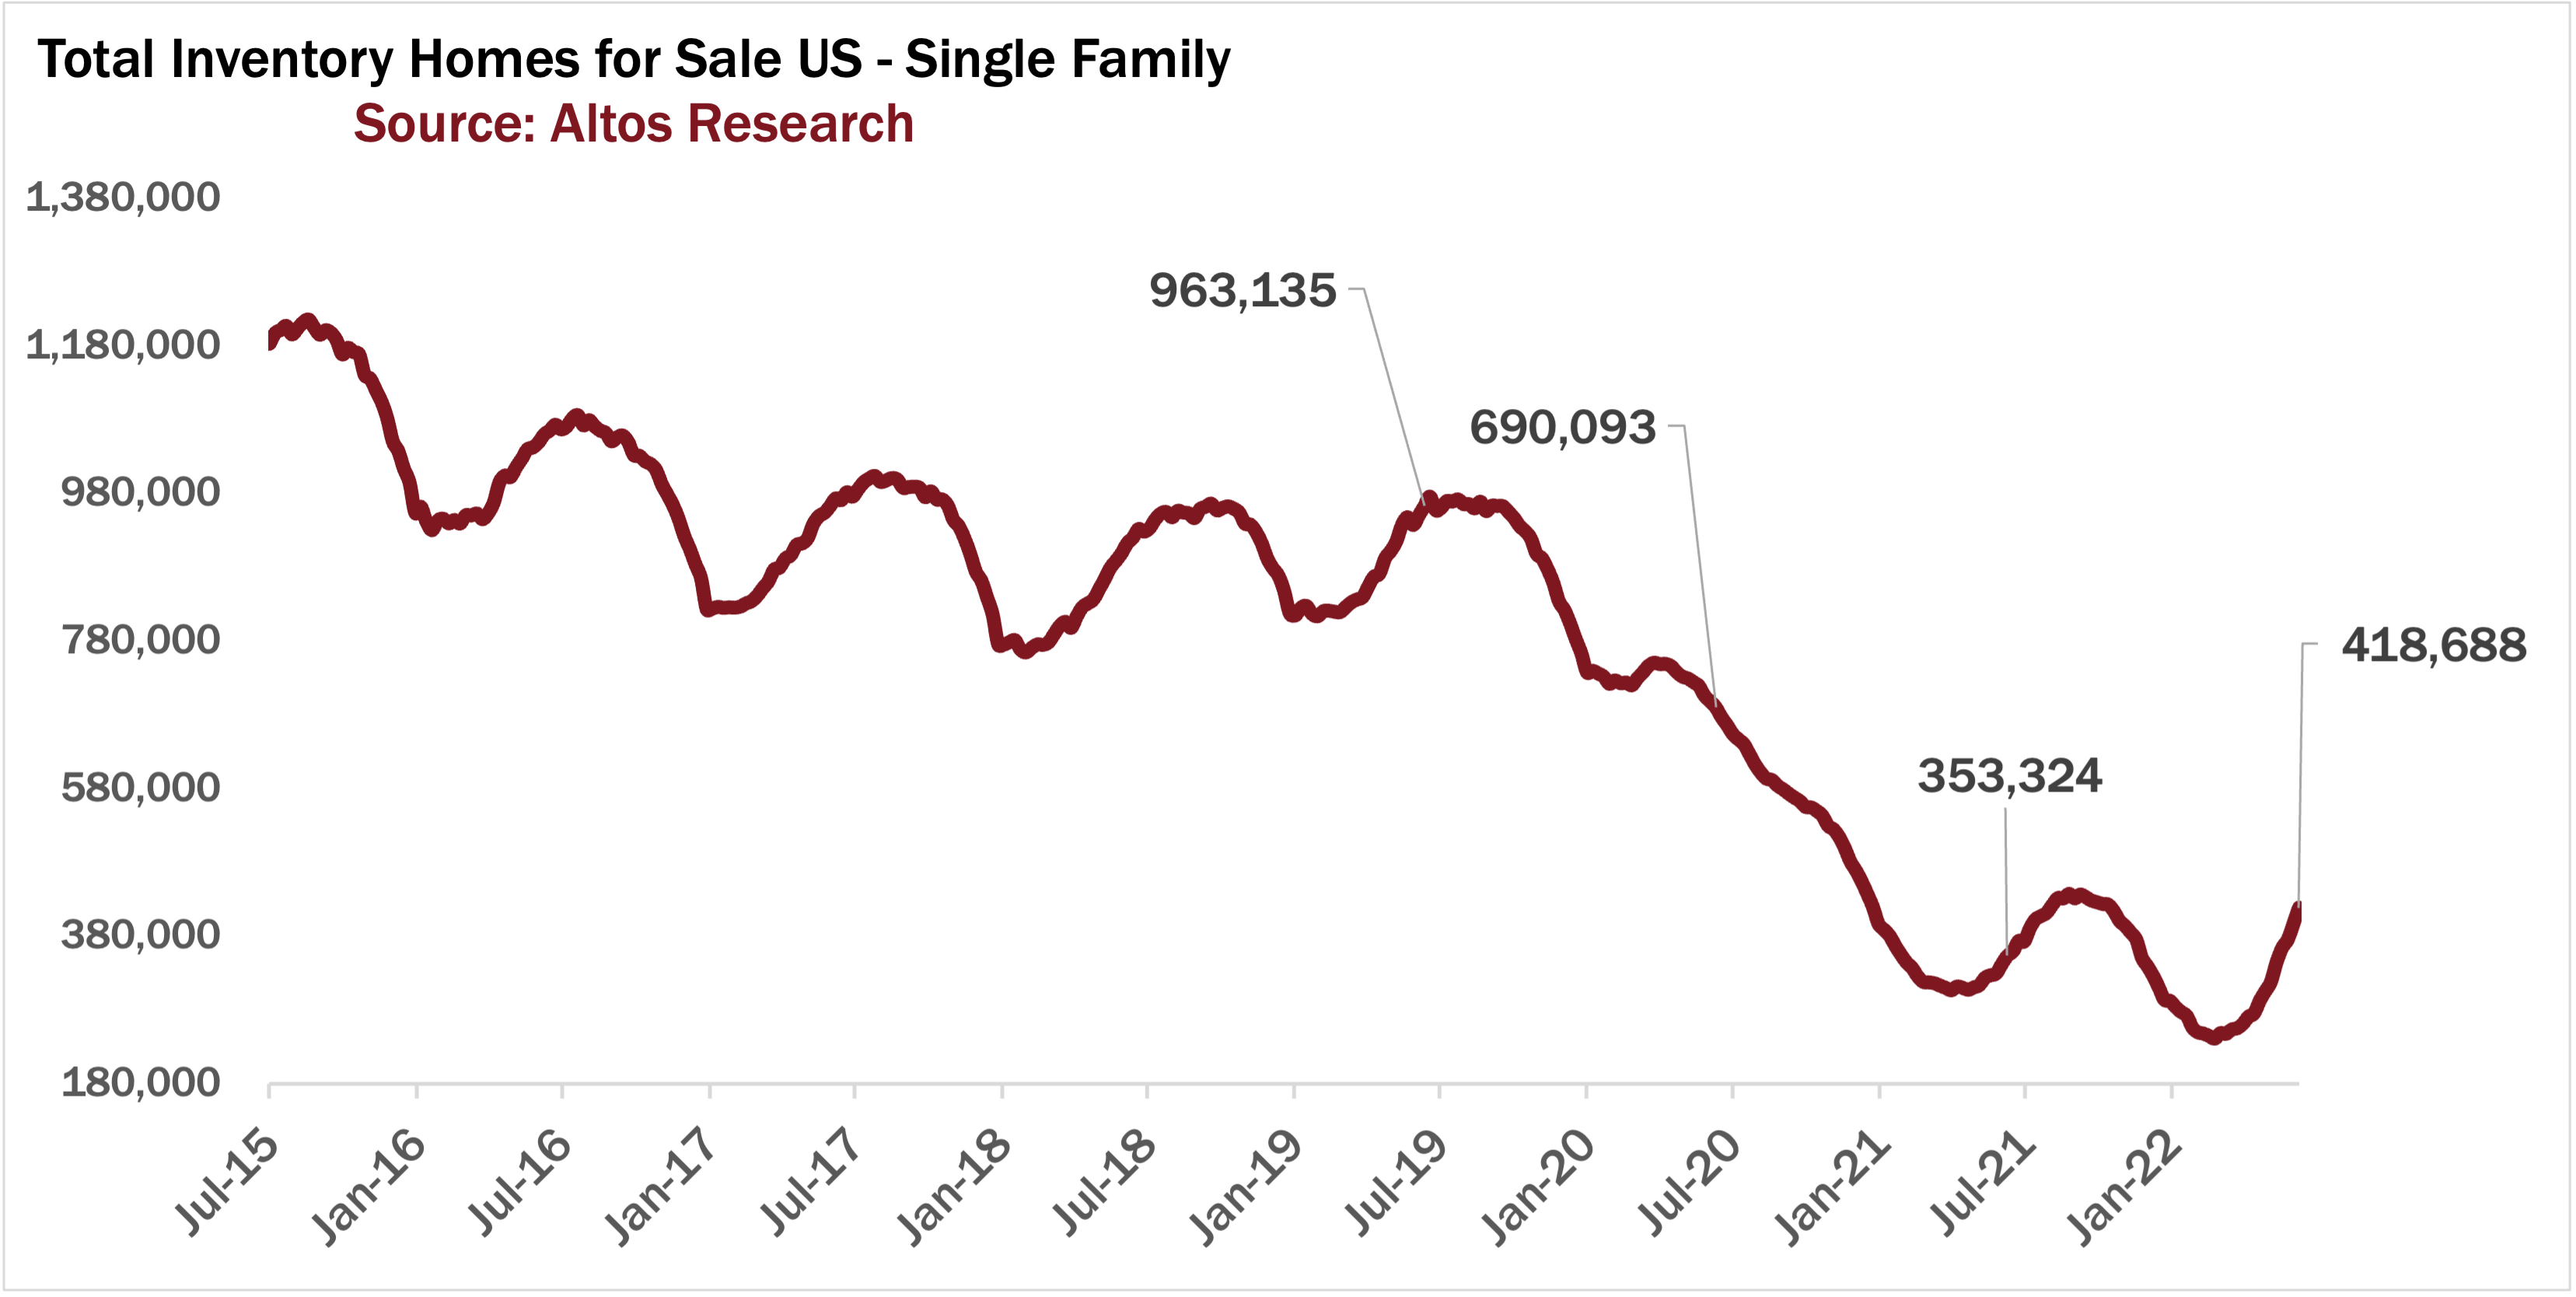
Inventory is growing for three main reasons:
- The insatiable buyer demand we’ve had for two years is finally starting to be satiated. With rising interest rates and falling financial markets, many buyers are priced out. They have to sit on the sidelines until something changes.
- On the supply side, higher mortgage rates mean fewer homes look good as investment opportunities. So the doubling up phenomenon we’ve had over the last decade where when I buy a new house, I keep the first home as a rental, this doubling-up makes sense for fewer people when mortgages are at 6% than they did at 3%. So those homes get listed for sale rather than kept as investment.
- The third thing adding to supply now are probably some investors using the opportunity to sell some homes and raise capital - these are people who anticipate a long, deep market correction and they’re preparing for the winter. We don’t have evidence of a lot of investors selling, but it’s something to keep an eye on. Especially in places like Phoenix with a lot of speculators.
Home Prices
Meanwhile home prices are hovering at their record highs. The median price of single family homes in the US is $454,000 this week. That actually ticked up from last week and is still 13% higher than last year. The end of June is usually the peak of home prices, so it should be no surprise that we’re still at record highs. Although I confess it is a little bit of a surprise to me, I’m looking at this market cooling every day, and that makes me forget just how strong it has been. So as this market normalizes, I suppose it is normal that we’d be at peak home prices for the year right now.
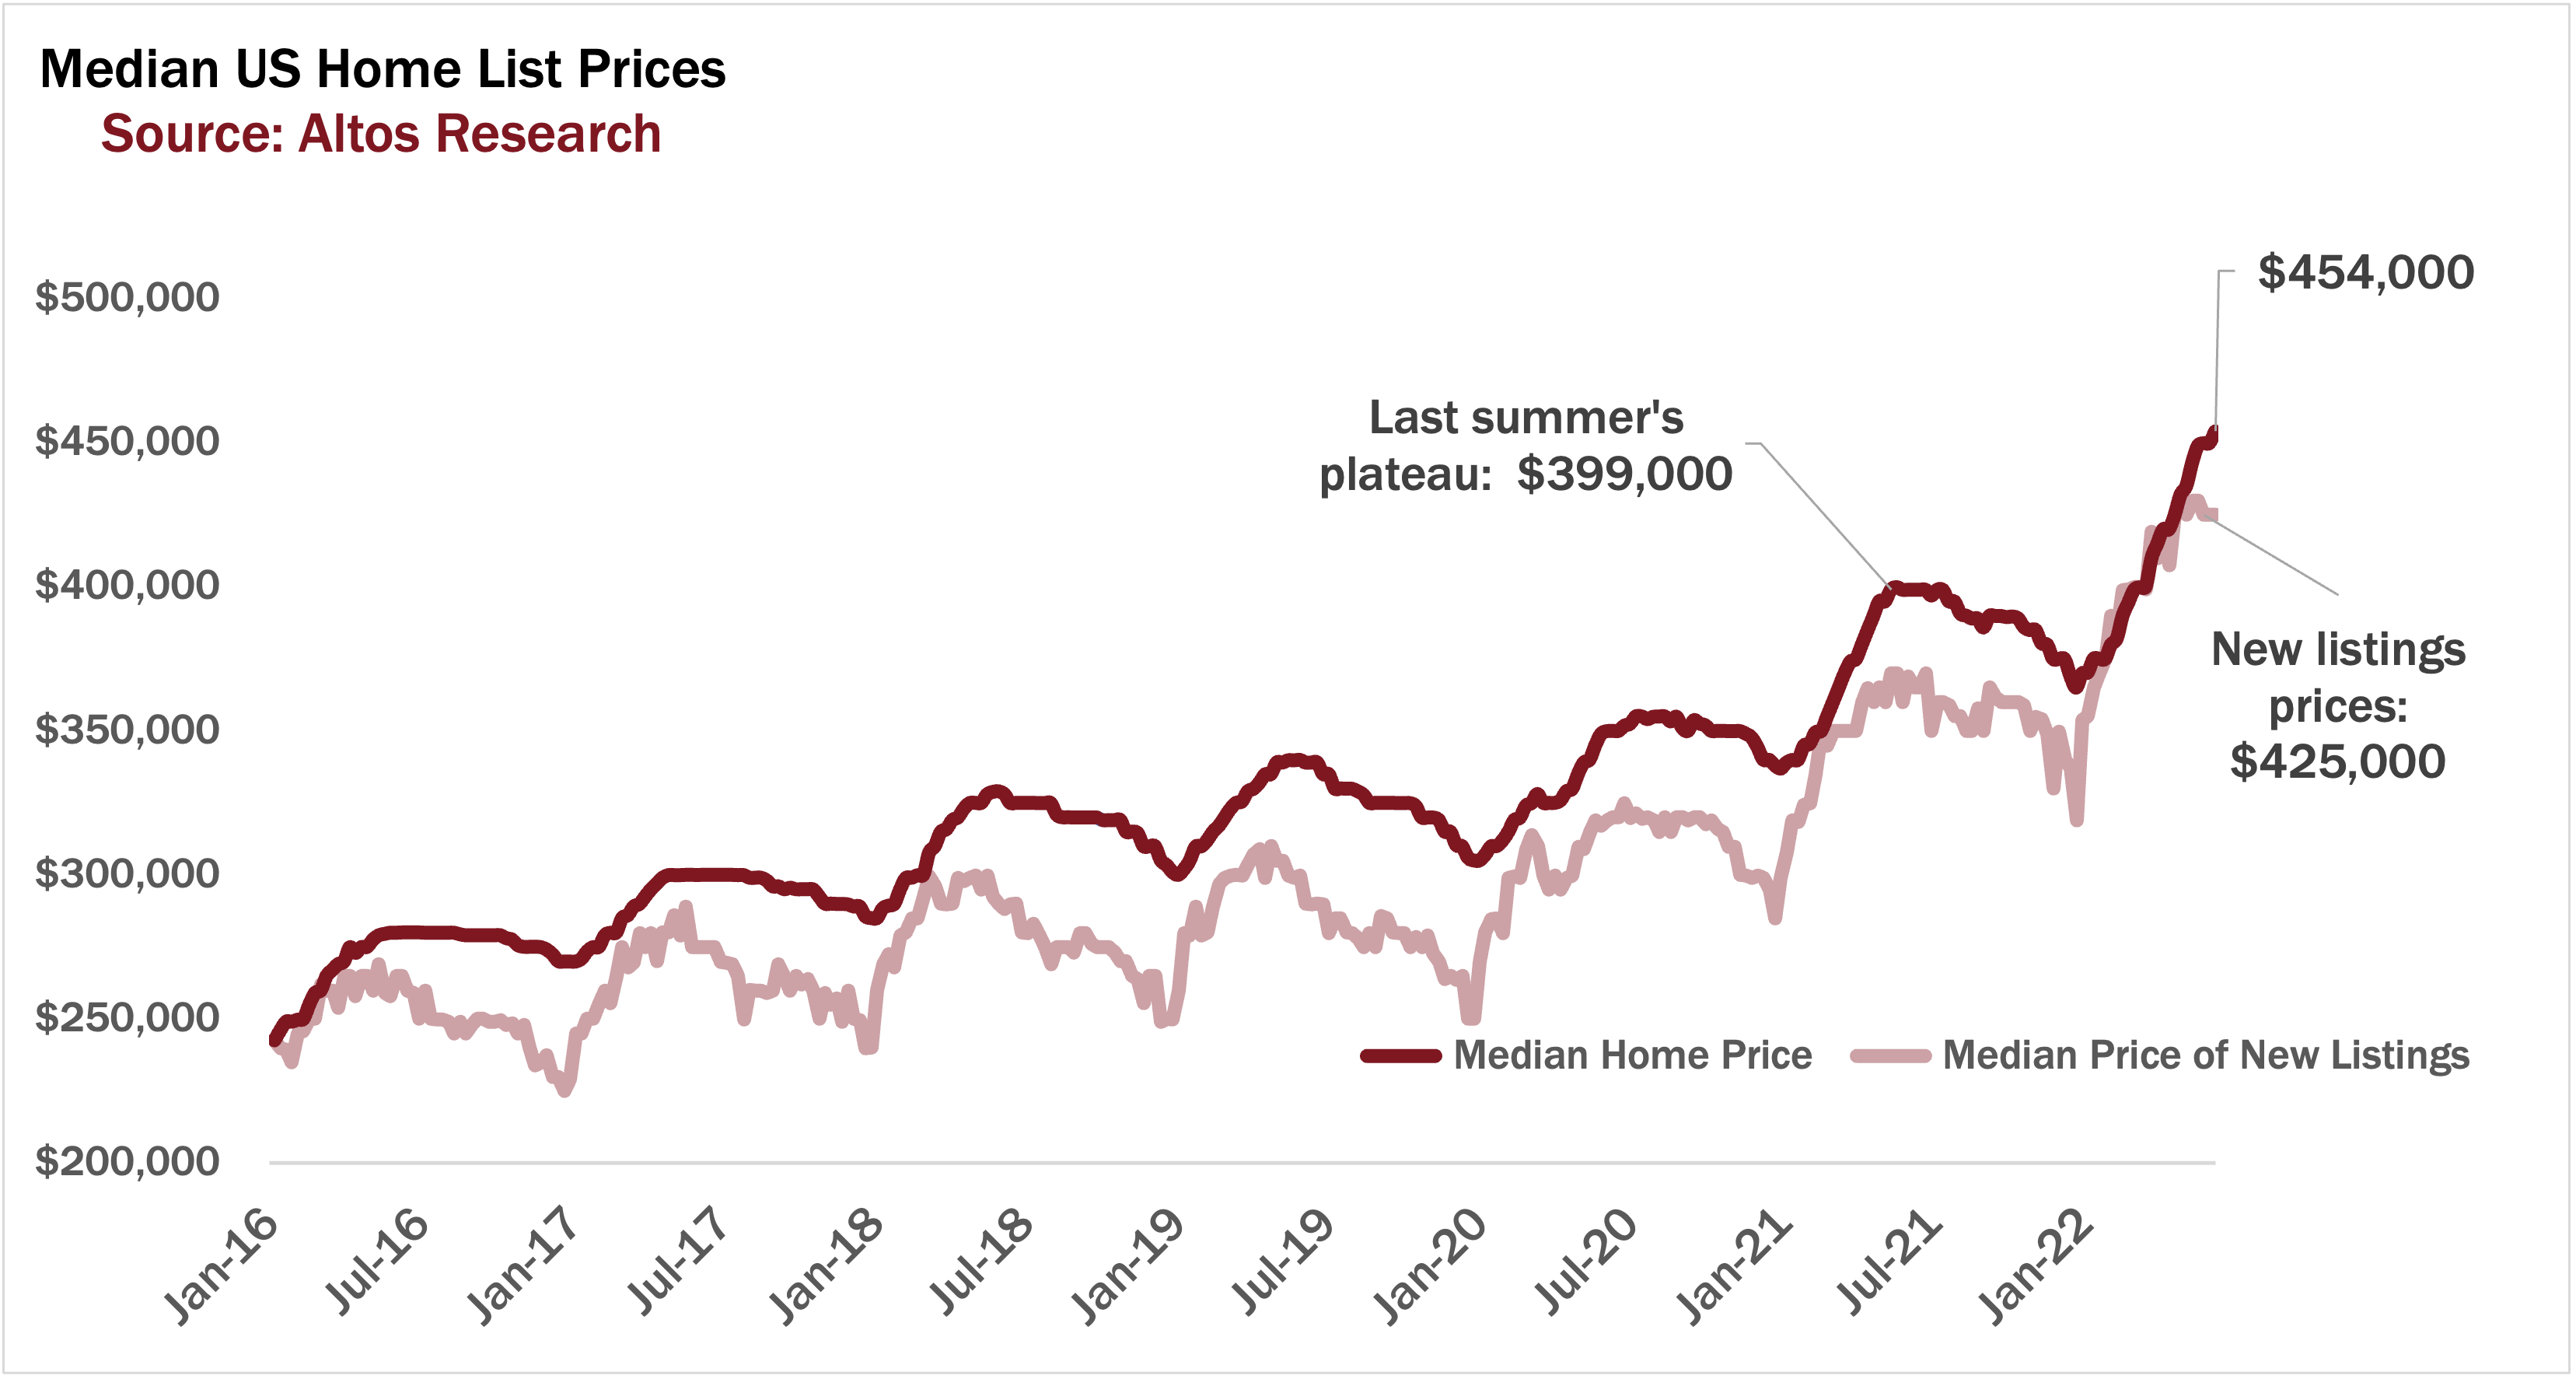
The price of the new listings is unchanged this week at $425,000. The price of the new listings isn’t falling week to week. That says that enough sellers are getting their bids that prices are holding. Are these sellers delusional? Will they be surprised at weak demand? Some of them will be. But those that are pricing properly are indeed moving. That seems like a good sign. Maybe we’re just early in the market correction. So keep your eyes on the price of the new listings as a leading indicator of future transaction prices. The price of the newly listed cohort peaked this year at the last week of May, which is exactly where we’d expect it to in pre-pandemic normal market conditions. That says to me “normal” not “scary."
Real Estate Price Reductions
But of course the story this summer is price reductions. How quickly this market is slowing. Remember that about a third of homes take a price cut before they sell. When the market is hot it’s fewer than that.
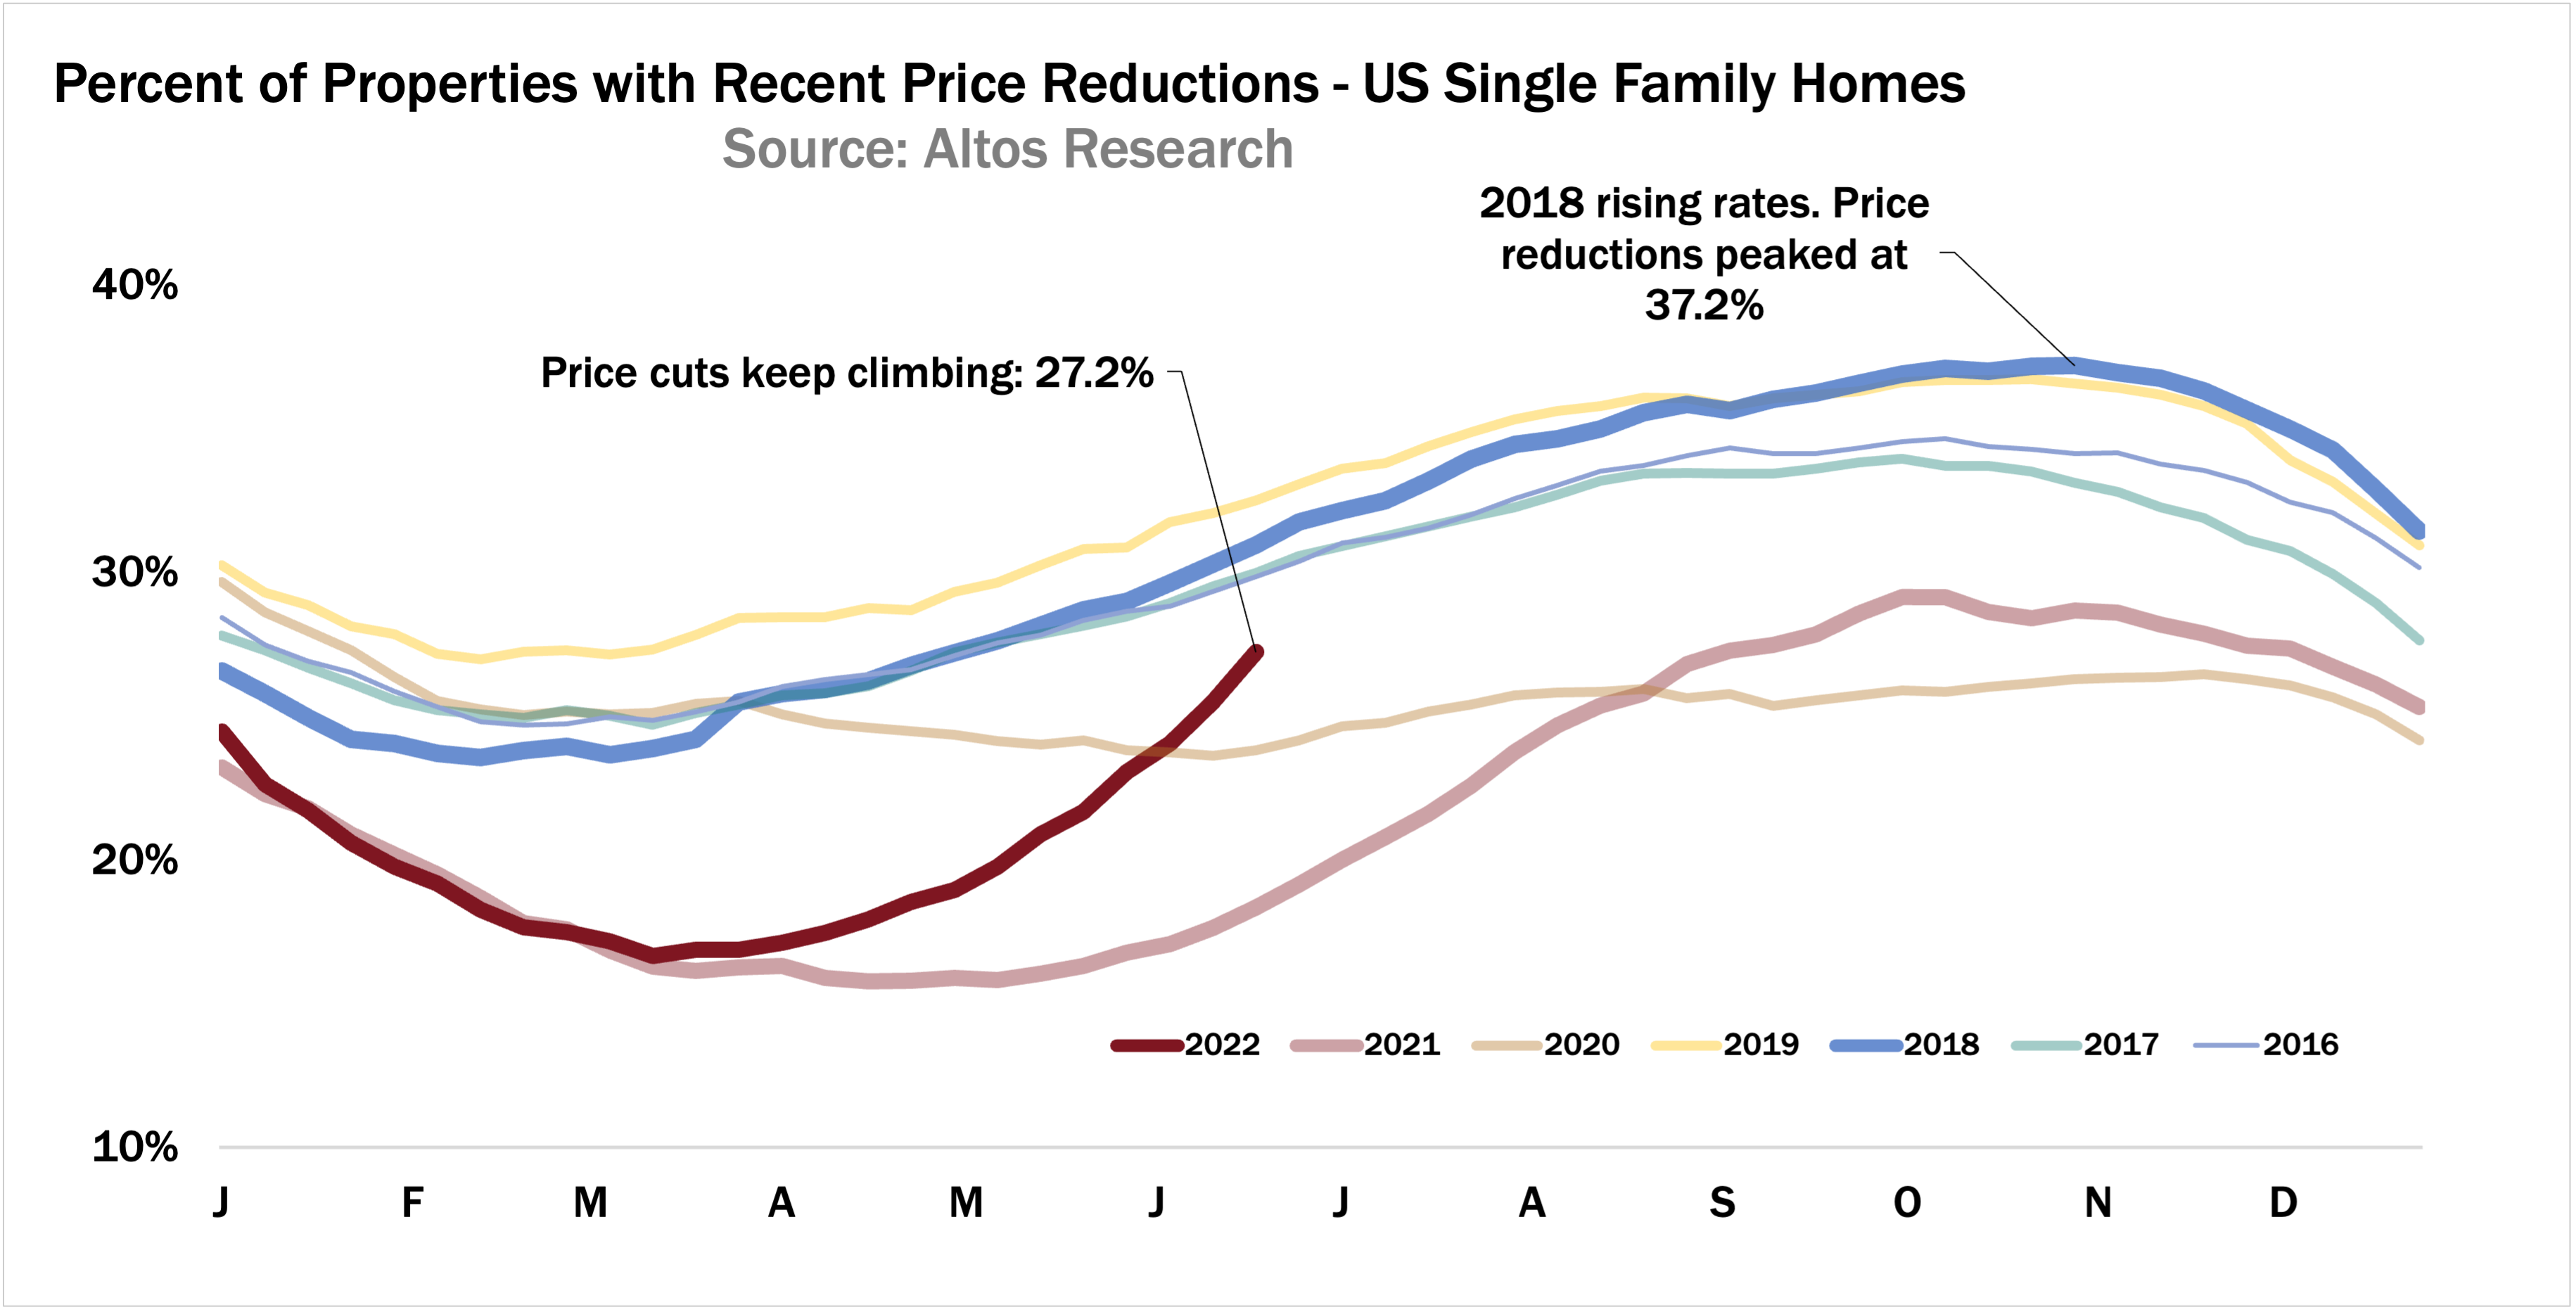
When demand was off the charts, we had record few price reductions. Price reductions are accelerating faster than ever right now. Very soon we’ll get back to normal levels - meaning by July a third of the market will have had to cut their asking price.
What’s going to be fascinating is to see price reductions plateau at its seasonal peak. In 2018, we had rising rates and that slowed buyers so price reductions peaked in November at 37% before the holiday reset. It sure looks like we’ll have more than that by then this time around. So sellers: this is why your imperative is to price properly now and don’t get behind this curve.
Interest rates peaked in December 2018 and it took most of the following year for the momentum to resume for buyers. By the end of 2019, home price gains were flat from the year prior. You can already see that for 2023. Unlikely to have home price gains next year.
Immediate Sales
With the bidding wars and immediate sales that have dominated the real estate market over the past two years, this week is down to 22.7% going into contract immediately after listing. Like prices, I keep expecting this to fall faster than it has been.
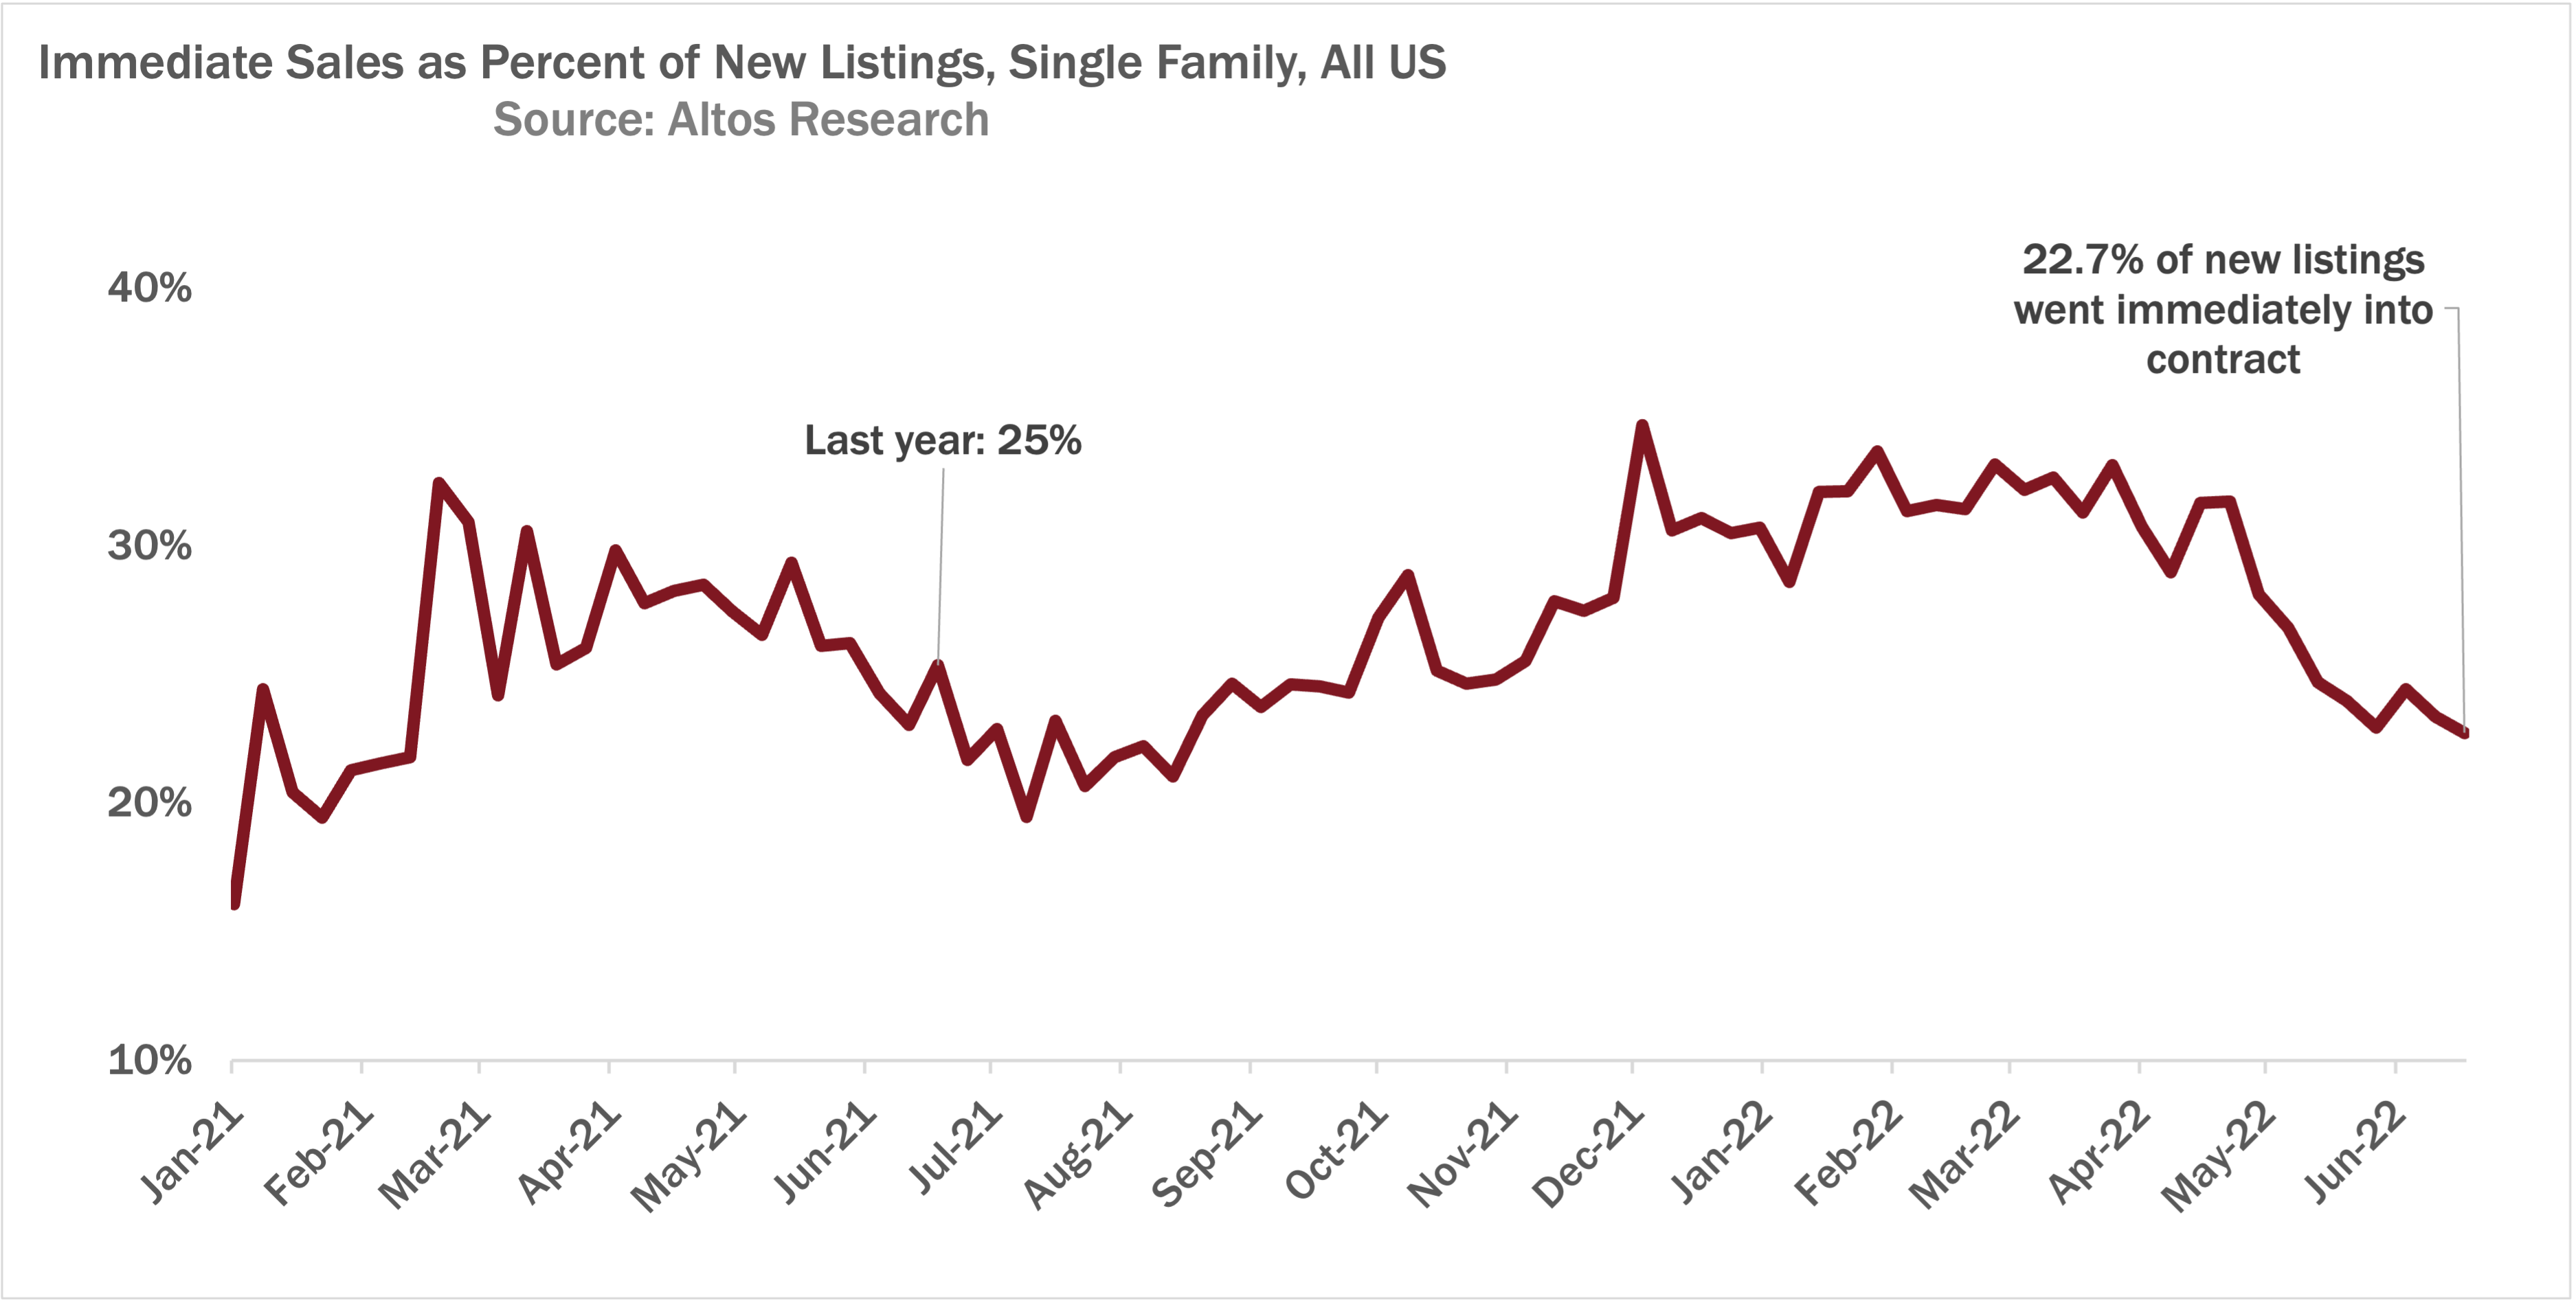
Last year the low point was the Fourth of July holiday week where all the transactions and listings slow way down. Keep your eyes on this pace of immediate sales to see whether buyers slow further after the holiday or if they resume a bit like they did last year. I expect that demand will continue to slide, but I’ve been wrong before. That's why we measure each week and report as we can.
Relistings
Here’s another leading indicator to watch as the market cools. This is percent of the active market that are re-listed. We’ve watched them on the market, get offers and go into contract, or sometimes get no offers and get withdrawn, and then they come back on the market 30 or 60 days later. As the market cools, more buyers get cold feet. Sometimes the financing fails. Sometimes the house is overpriced, gets no offers, and the seller withdraws the listing, maybe changes realtors, and re-lists. There are always some relistings happening.
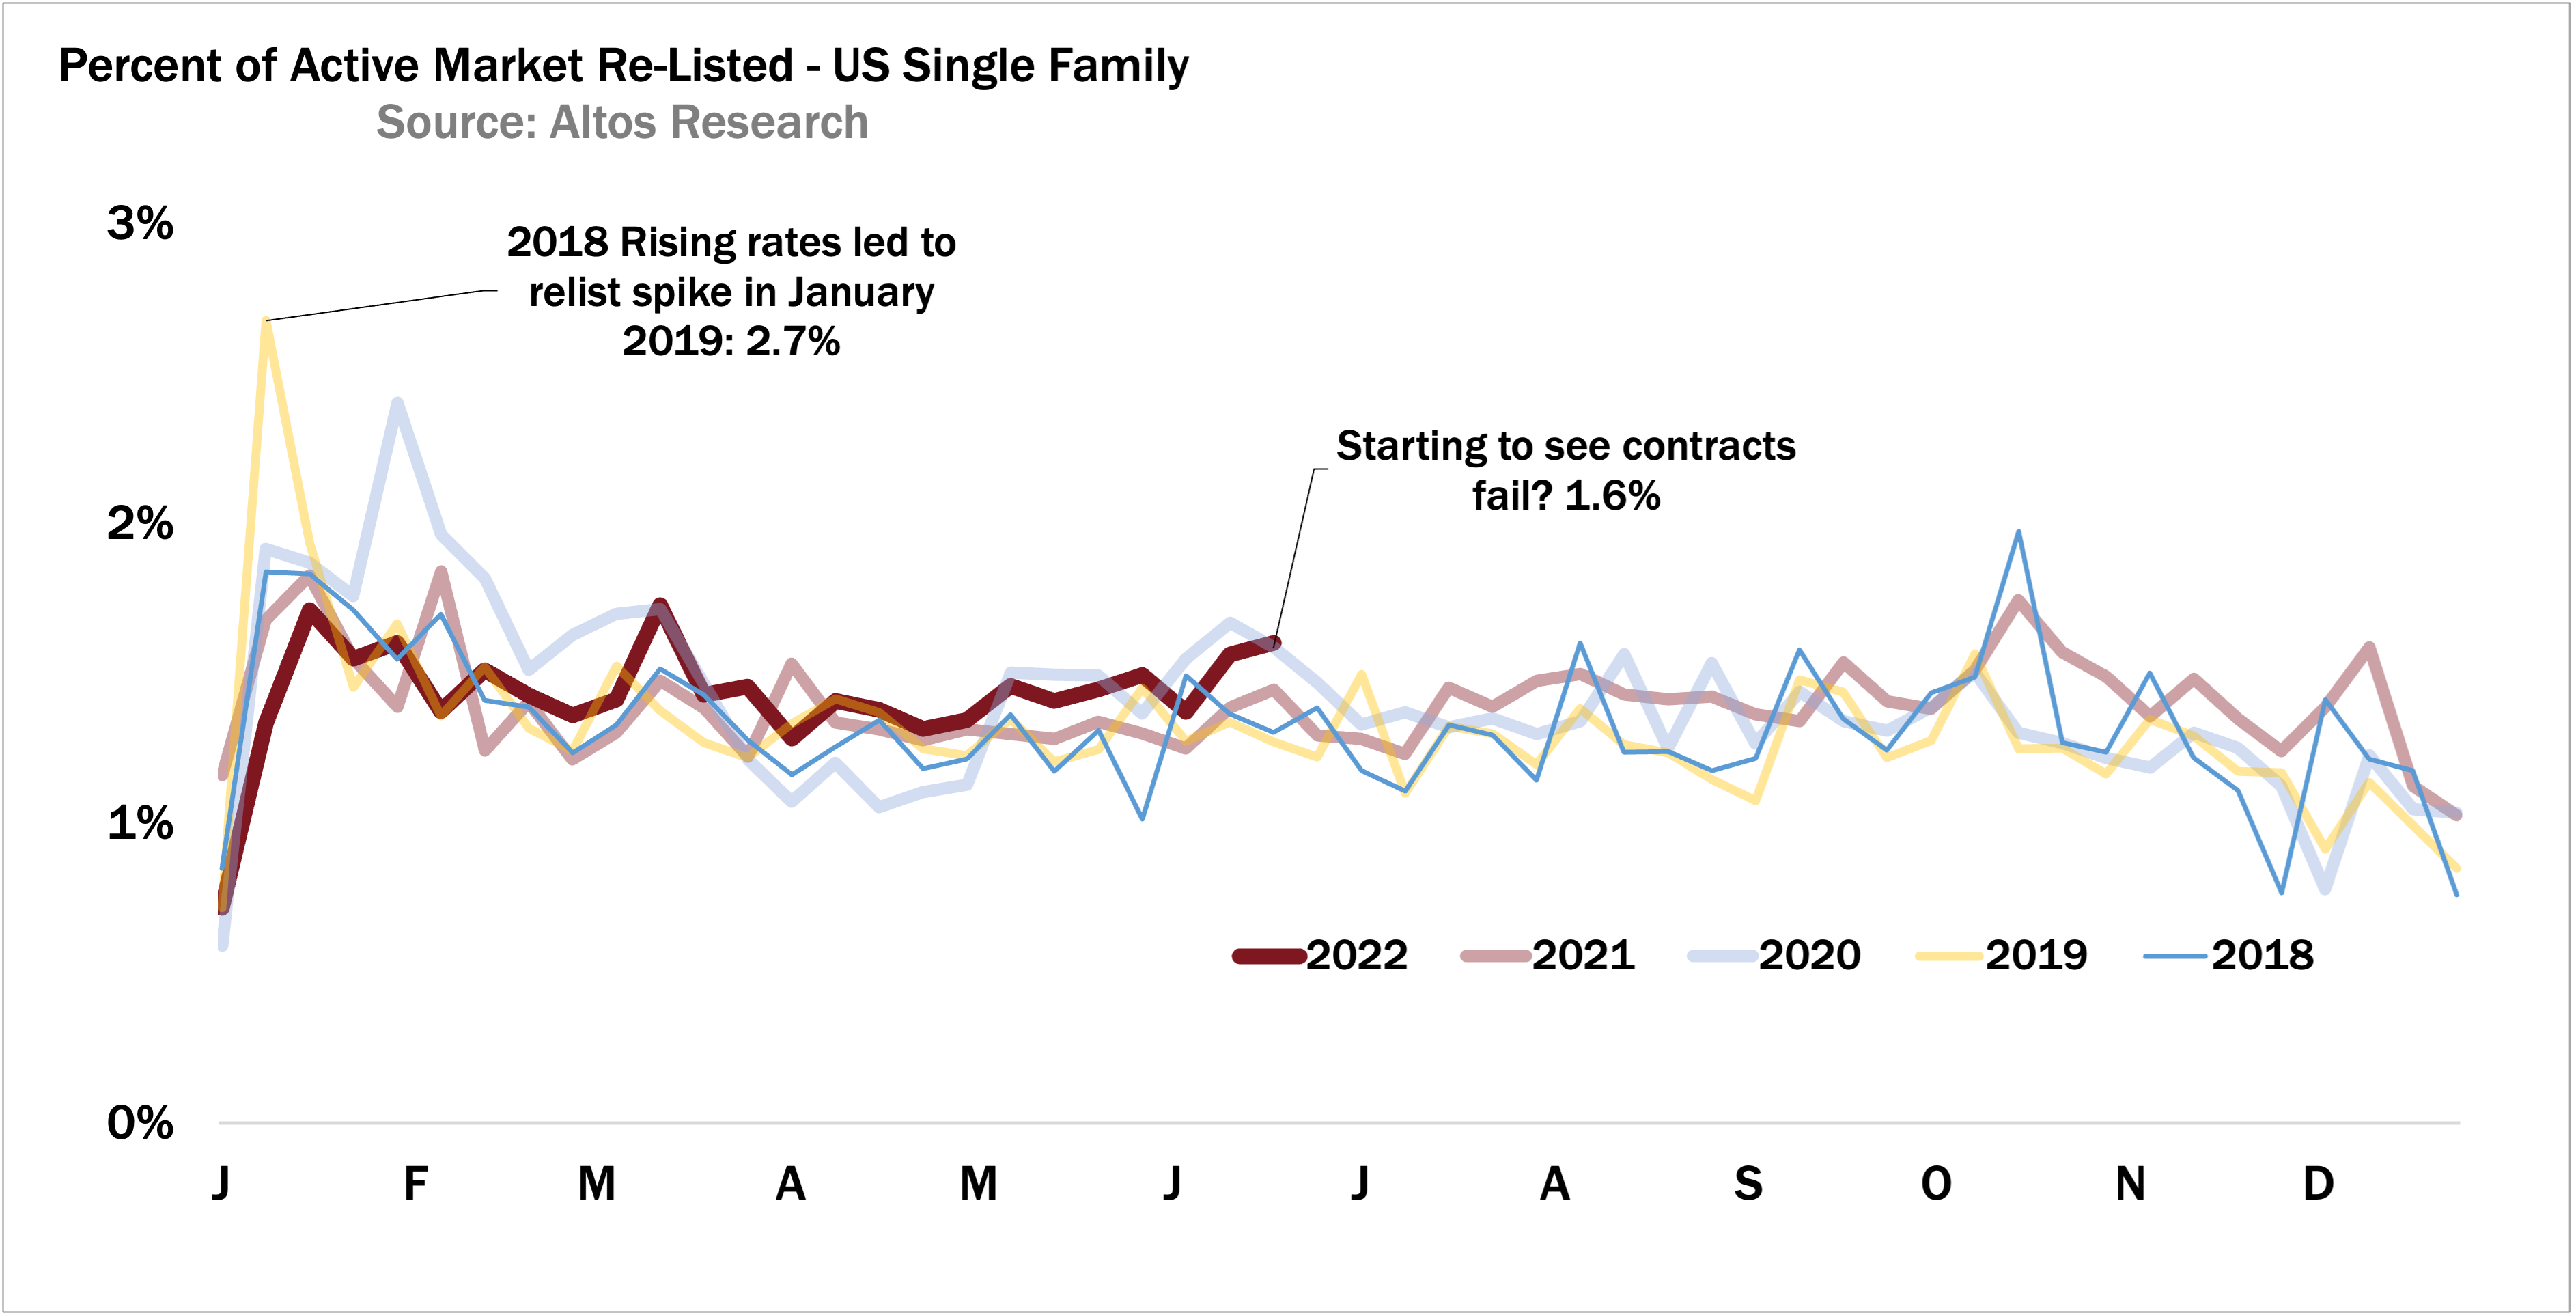
Each year there’s a January spike of homes that got pulled over the holidays. Depending on the local realtor associations, sometimes agents do this to reset the days on market and make it look like a new listing. This week 1.6% have been relisted. This is gently climbing above previous years.
When the housing bubble burst in 2007 we could watch markets like San Jose where relists climbed to like 30% of the market. So one thing we’re watching now is do relists keep climbing? How far? This would be a bearish signal and indicate things like: there are no backup offers, or no offers at all. So when relists climb, that implies transactions out in the future will have to be done at lower prices.
Agents when you’re counseling your sellers this is one way to communicate with them. Yes, the market is still surprisingly strong for the homes that are priced properly. But price reductions are climbing so quickly, the ones that don’t price right are going to have even worse conditions later in the year.
If you need to have these conversations with clients, go to AltosResearch.com and sign up now so you can have your data in the hands of your potential sellers and buyers today.
That’s all the data we have time for today. More next week.
