
Mike Simonsen
Mike Simonsen is the founder and president of real estate analytics firm Altos Research, which has provided national and local real estate data to financial institutions, real estate professionals, and investors across the country for more than 15 years. An expert trendspotter, Mike uses Altos data to identify market shifts months before they hit the headlines.
The growing available inventory of homes in this country for sale has dramatically slowed. Just a few weeks ago I assumed inventory would keep surging well into late summer. I assumed that as buyer demand backed off inventory would pile up.
But now in mid-August the market is showing us very different evidence about the American homeowner. Home owners aren’t interested in selling in a weak buyer environment. They’re nervous about the economy. And they have their super cheap mortgages to keep forever. If you don’t have to sell you don’t sell.
As a result, it now looks like we might peak below 600,000 homes on the market this summer. And probably end the year with 525,000 homes. That’s less than we were modeling just a few weeks ago.
Every week Altos Research tracks every home for sale in the country. We analyze all the pricing, supply and demand, and all the changes in that data and we make it available to you before you see it in the traditional channels. If you aren’t using Altos market reports with your clients, your buyers and sellers, now might be the time to step up. Go to AltosResearch.com and book a free consult with our team. Because everyone is worried about what’s happening right now. They need you to help them see clearly.
I’m Mike Simonsen, I’m the CEO of Altos Research. Here’s what we’re looking at for the week of August 15 2022.
Real Estate Inventory
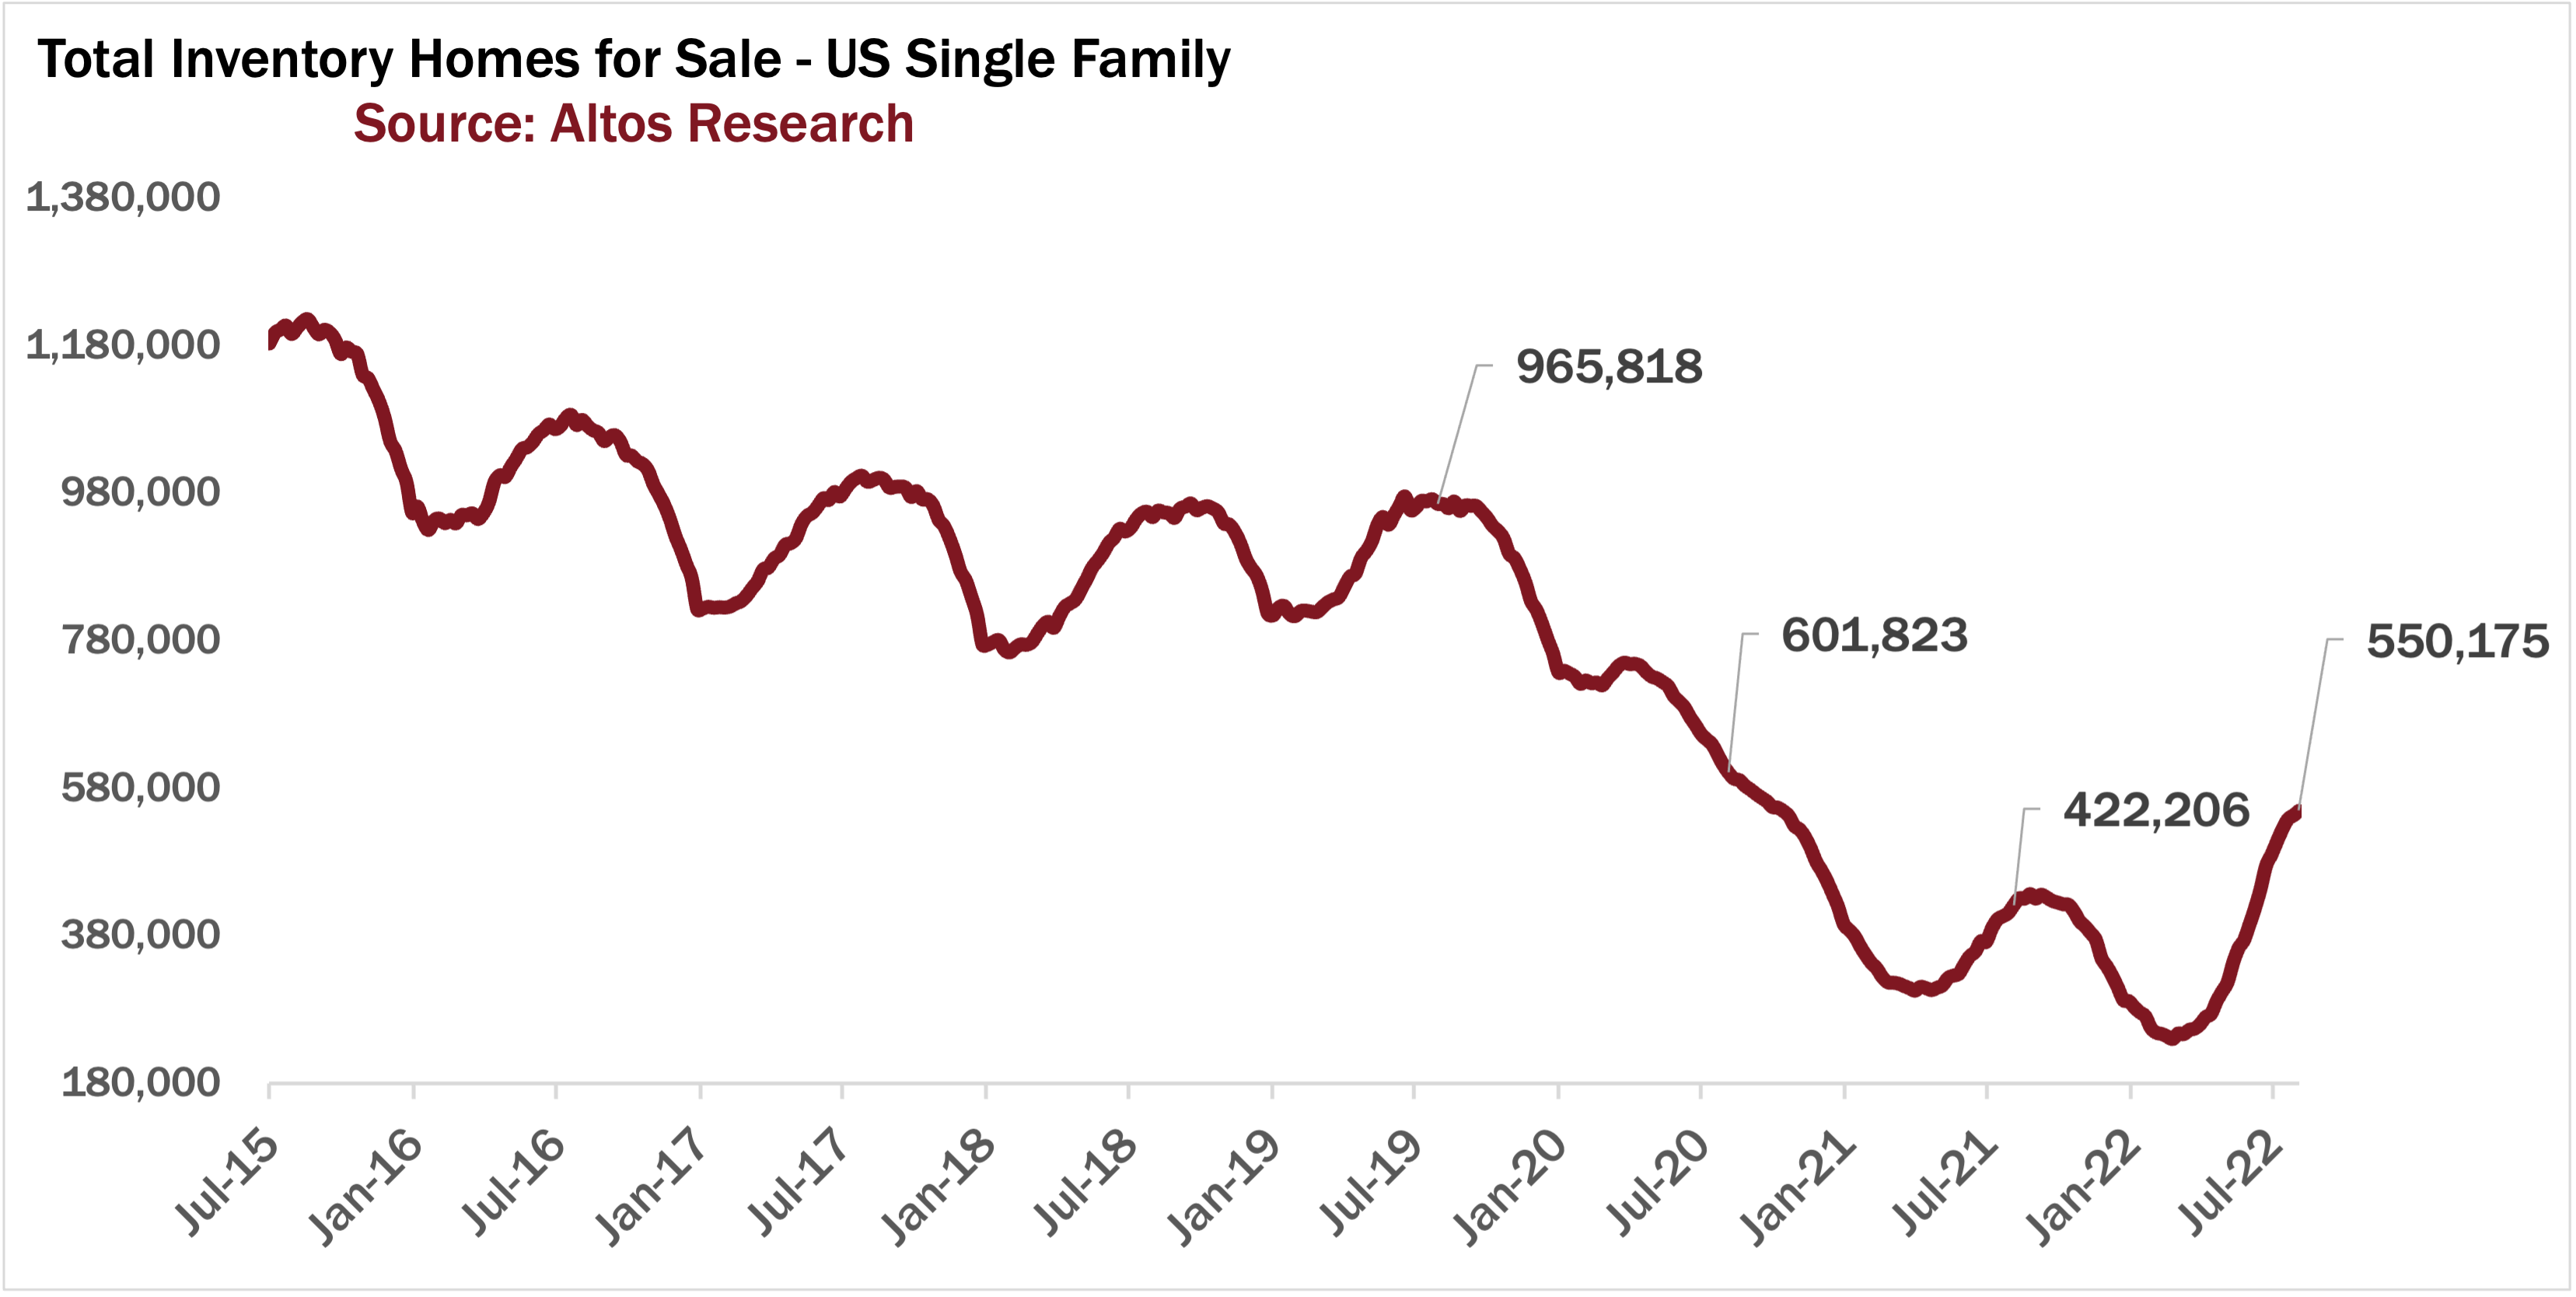
This week available inventory of homes for sale climbed just over 1% to 550,000 single family homes active unsold on the market. That’s 30% higher than last year at this time. What’s interesting is that last year in mid-August inventory climbed faster than it is right now. We add 6000 net new listings this week, where mid August last year we added 11,000. You can kinda see this in the chart here with the bump in the curve for last year still rising mid-August where this year we’ve turned the corner.
When thinking about how high inventory will grow or not grow, a wild card here is how much of the new construction in process will complete and when it will get listed for sale. We have record numbers of homes under construction in the US. So maybe we get some unseasonal lift late in this year’s inventory curve - if those houses for example hit the market in September or October.
But, assuming we’re back on what looks to be a more normal seasonal curve, that would imply inventory reaches its 2022 peak in late September at right about 600,000 before falling back to 525,000 to end the year. If you recall, just a few weeks ago, I estimated 535,000 and some very smart people suggested that projection was too low. But fewer sellers have been listing each week than our model projected. The weekly model still allows for some pretty big weekly inventory gains over the next month, so this projection could end up lower still. See the dotted line for the weekly projection of this year’s inventory curve.
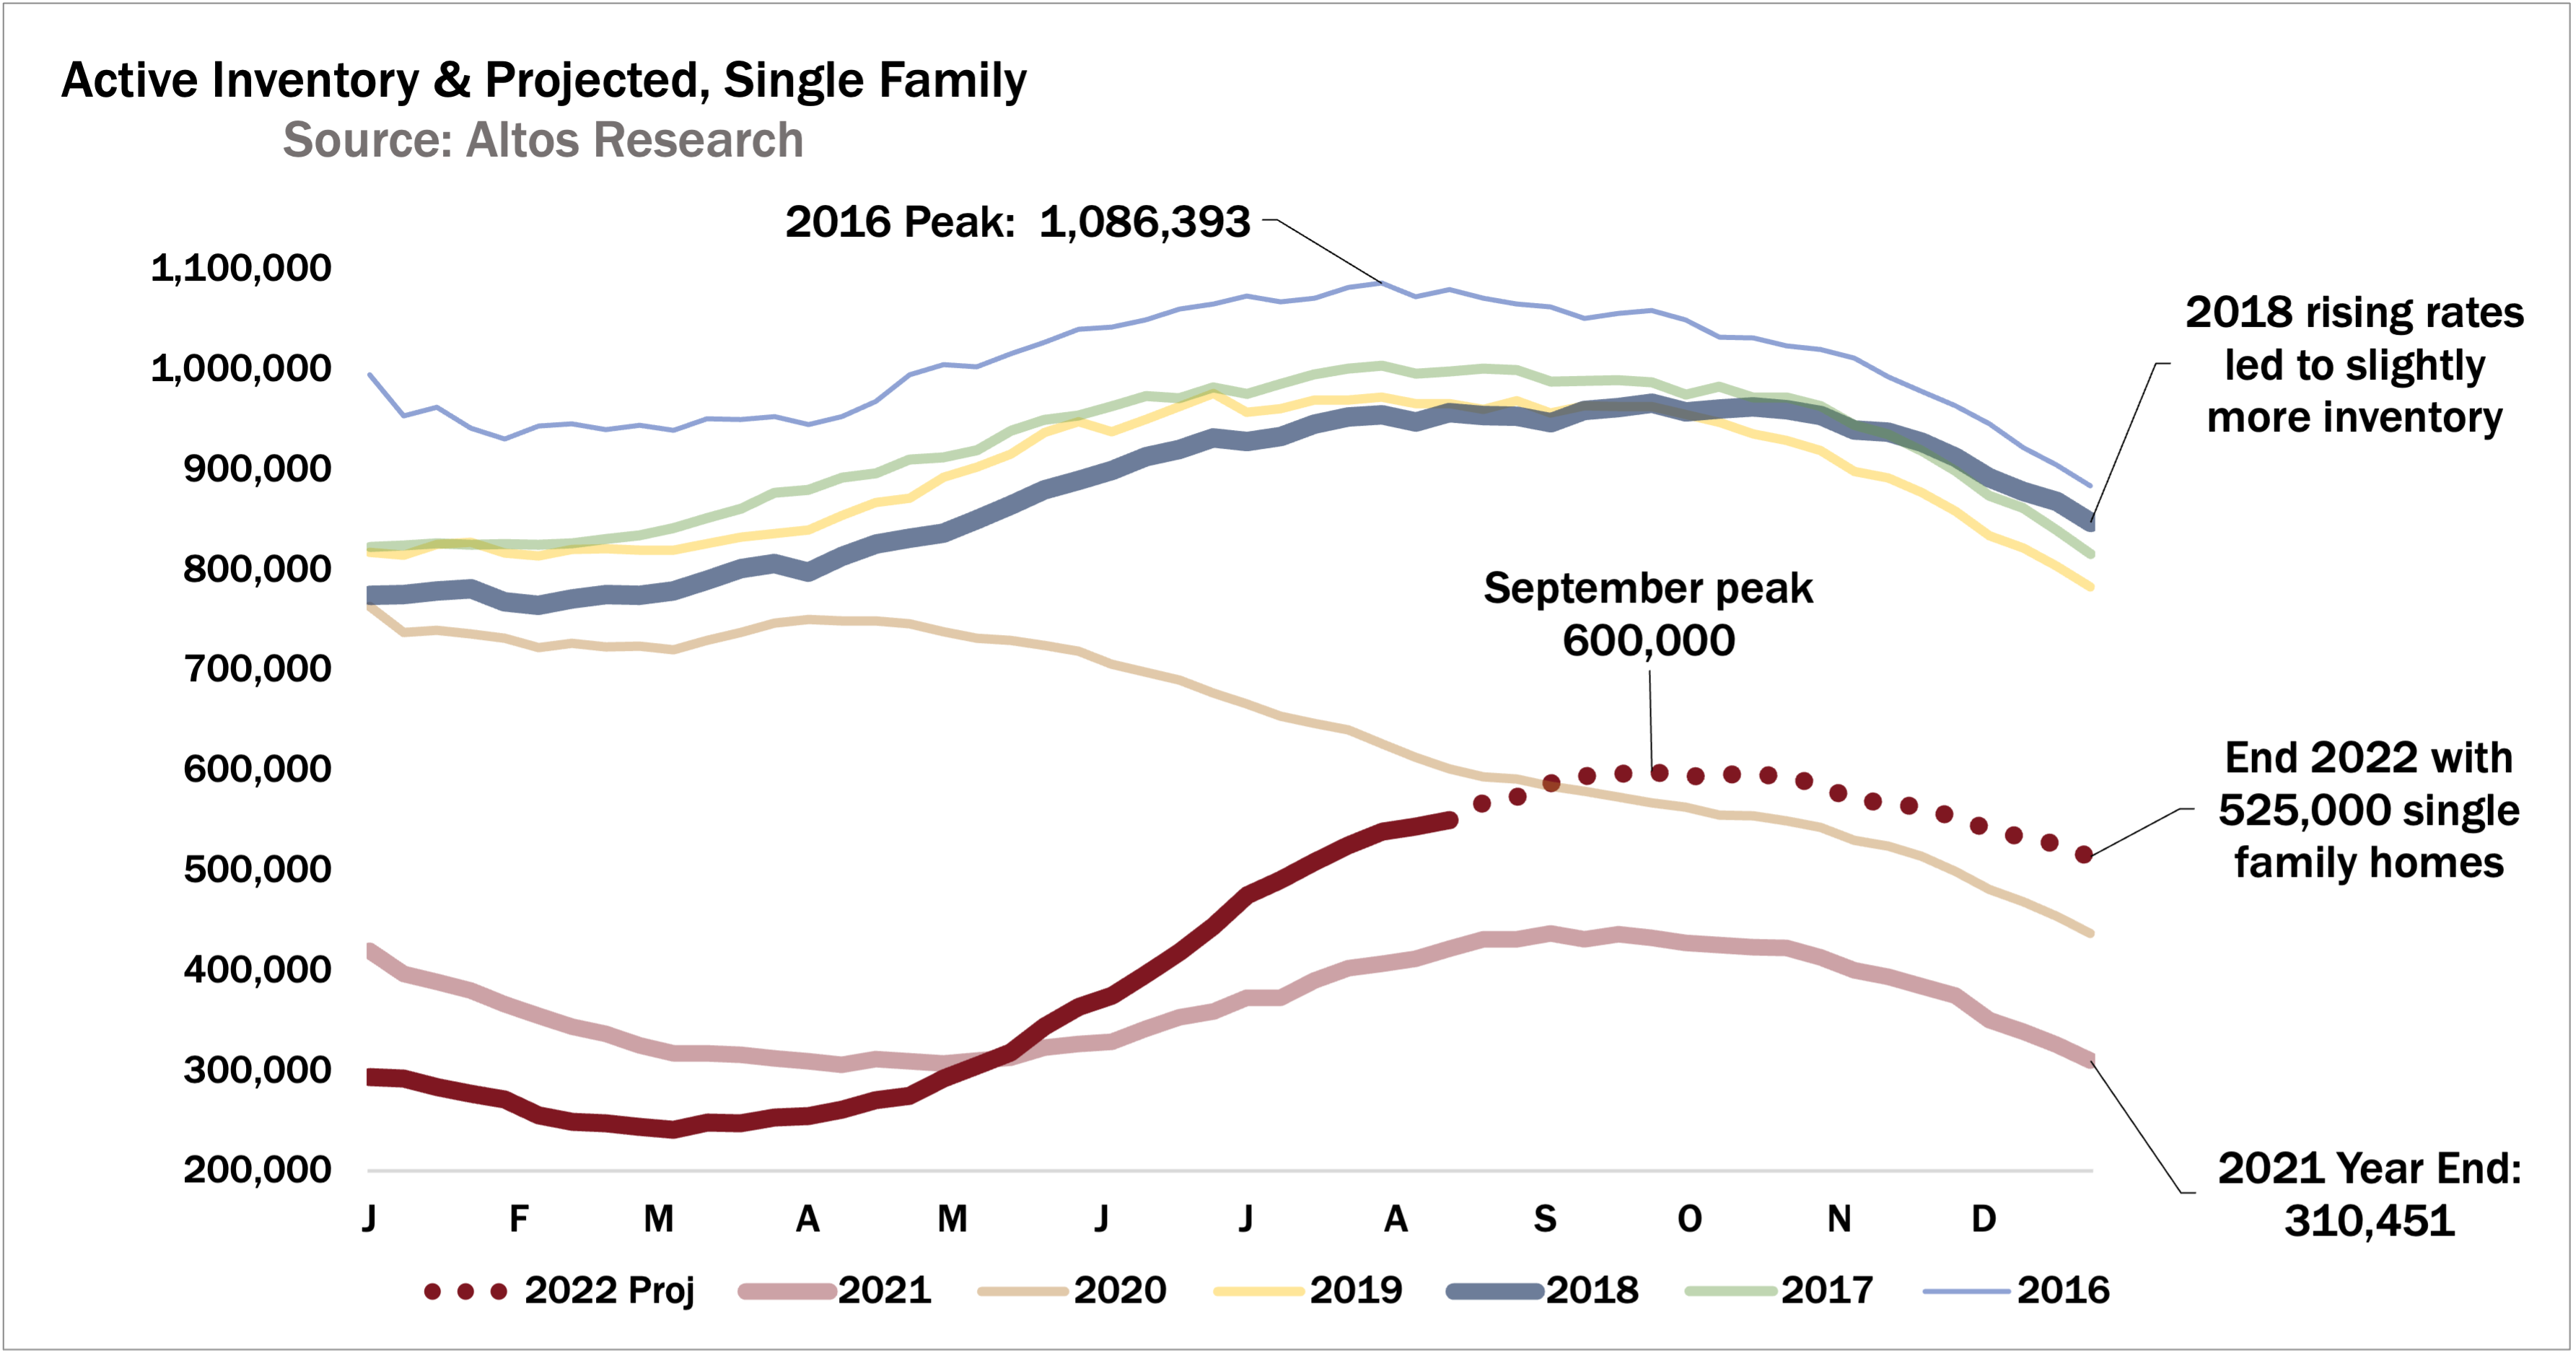
Inventory levels are still below 2020 you can see here, just two years ago when the pandemic buying frenzy started and available inventory dropped so rapidly.
But sometime in the next couple months we’ll break above that line. I don’t see anything in the trends right now that suggests we’ll be back to those healthy old normal levels of inventory, the higher curves on this chart any time soon.
One scenario would be a big deep recession with a lot of unemployment. This week on the Top of Mind podcast I sit down with Daren Blomquist of Auction.com and dive into their data on the dynamics of distressed mortgages. Daren shares his insights about how long it takes between recession and when we might see some inventory in the real estate market. That one drops later this week. It’s great.
Real Estate Prices
Prices meanwhile are holding steady as you’d expect for August nationally. The median price of single family homes in the US this week is $449,000 that ticked down just a fraction. My exception is that the median home price should start ticking back each week now between here and the end of the year. Likely end the year around $415,000 median home price.
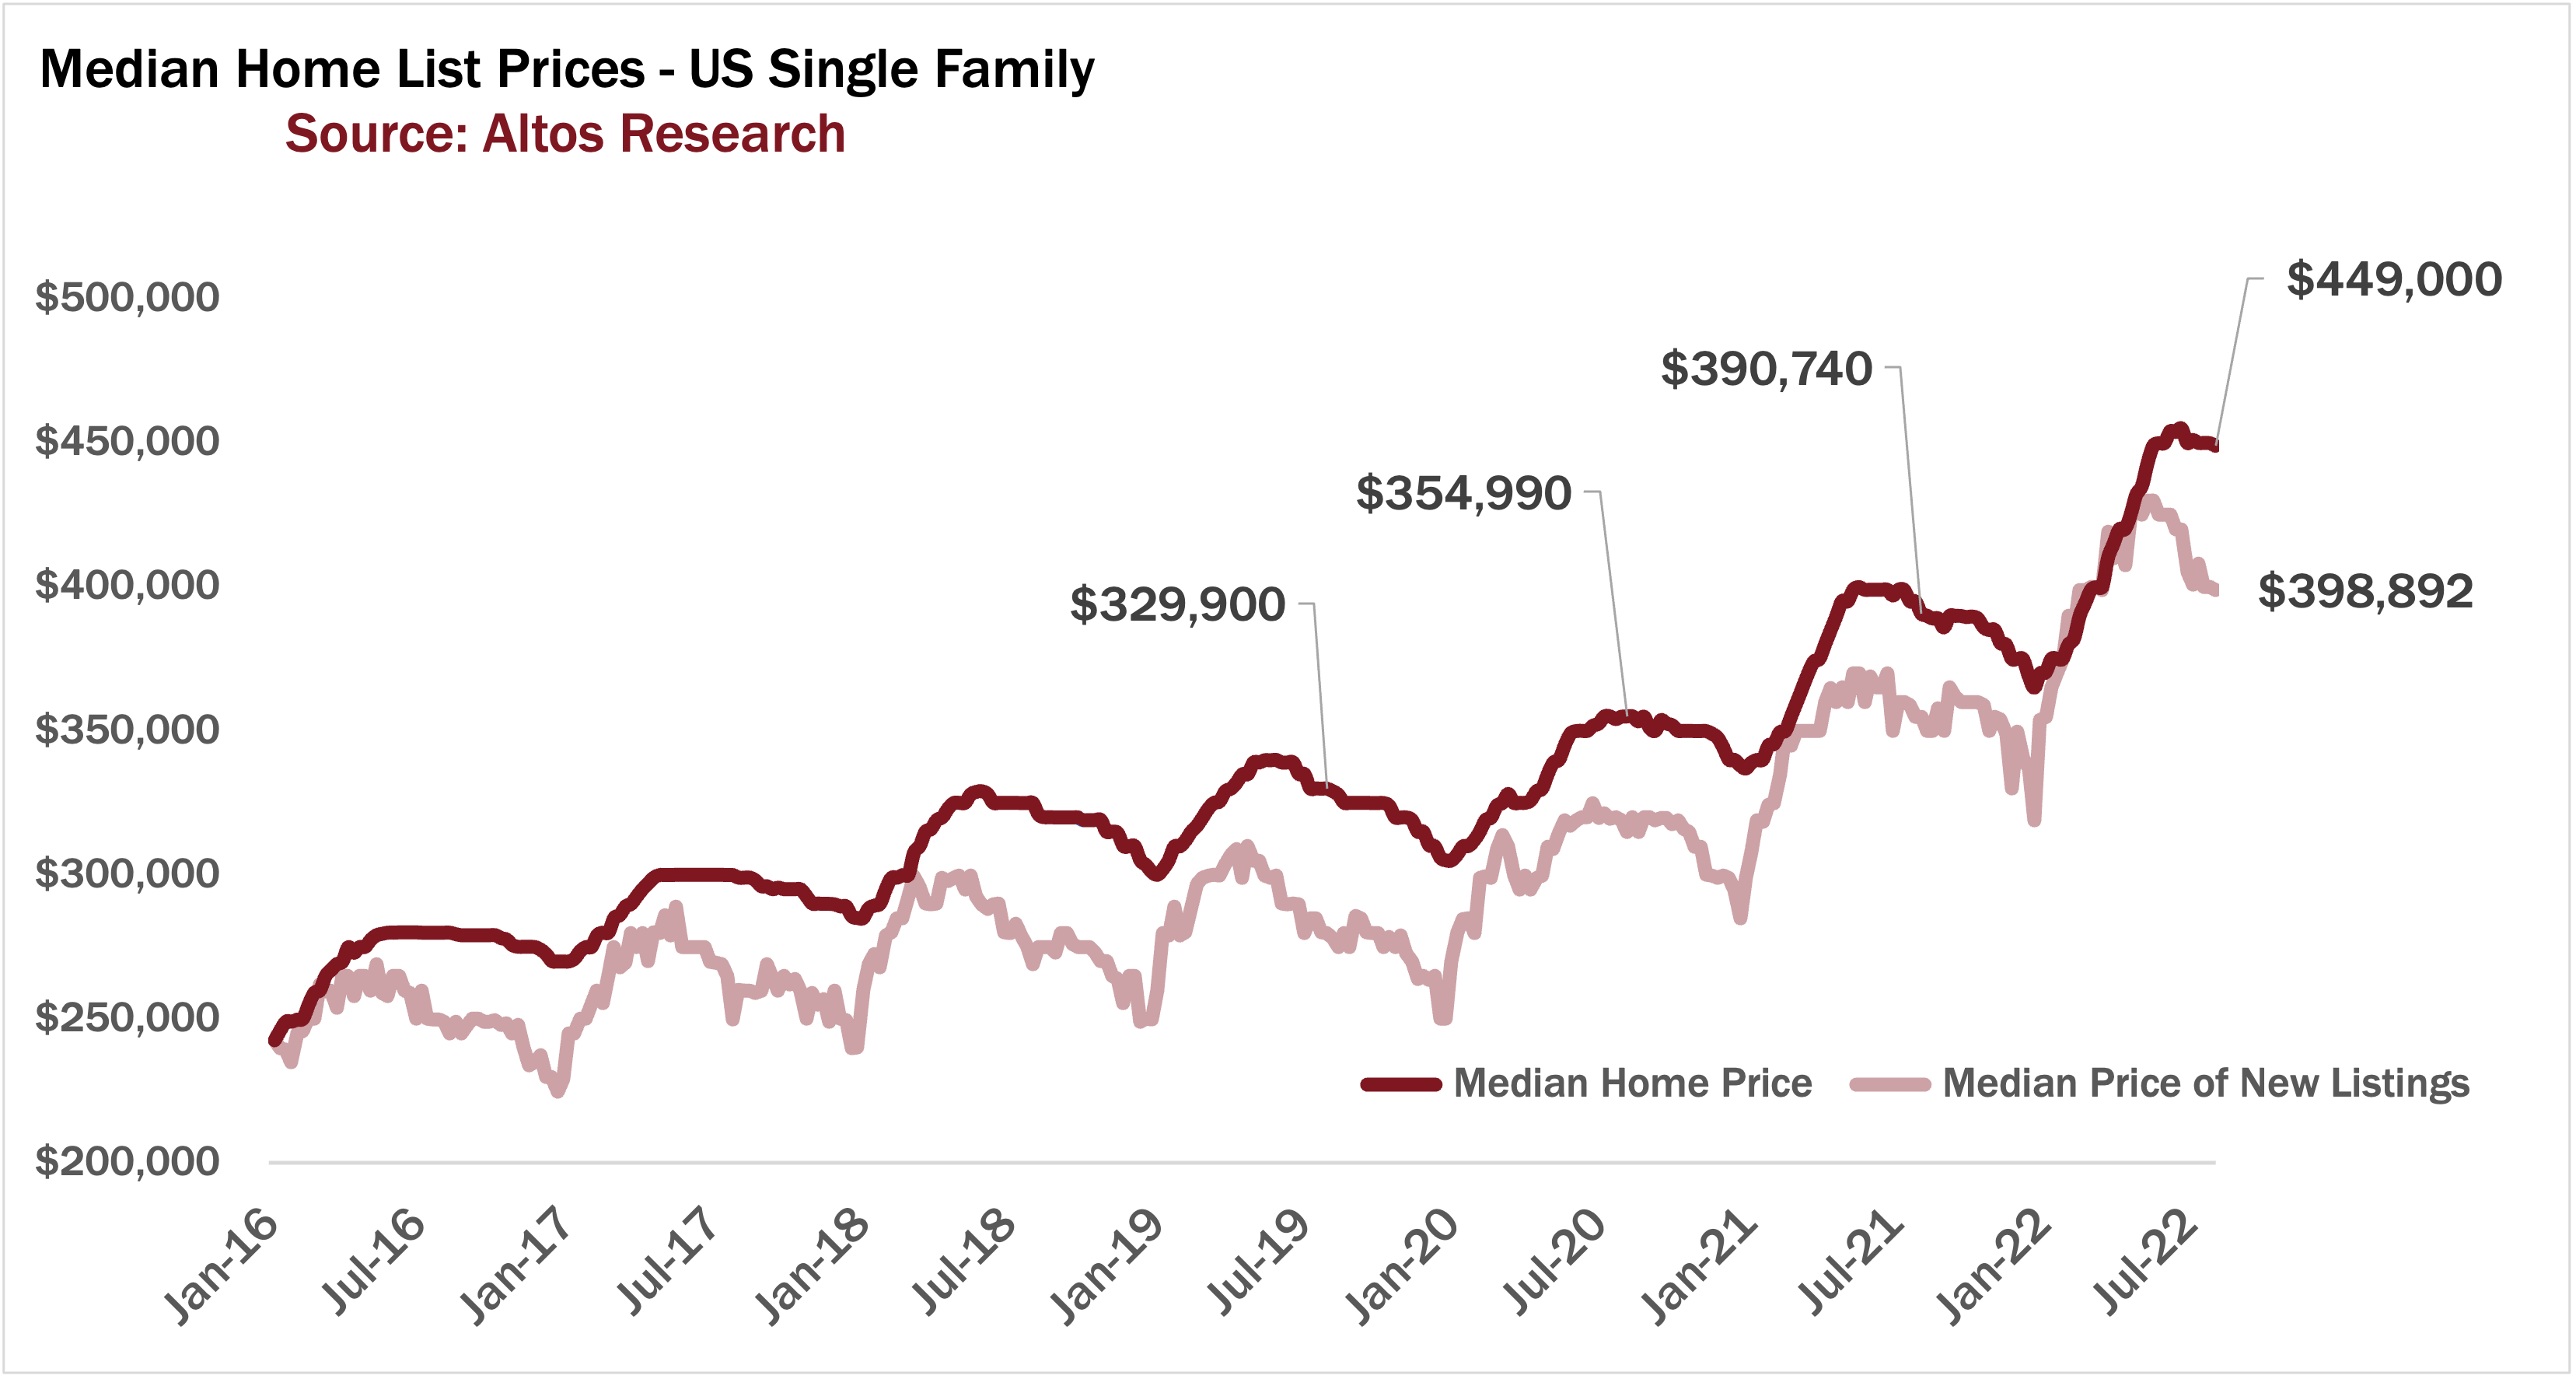
We’ll finish the year around 10% annual home price gains for 2022, but we’re set up for essentially zero gains in 2023. We’ll revisit the 2023 home price appreciation estimates as the year progresses and we get some data especially in January.
Lots of ground to cover there first.
Price Reductions
Because here’s the demand indicator we’re watching. The percent of homes that have taken a price reduction is up to 38.4% this week. 38% of the homes on the market have had a recent price cut from their original listing price. Every year in August price reductions climb weekly.
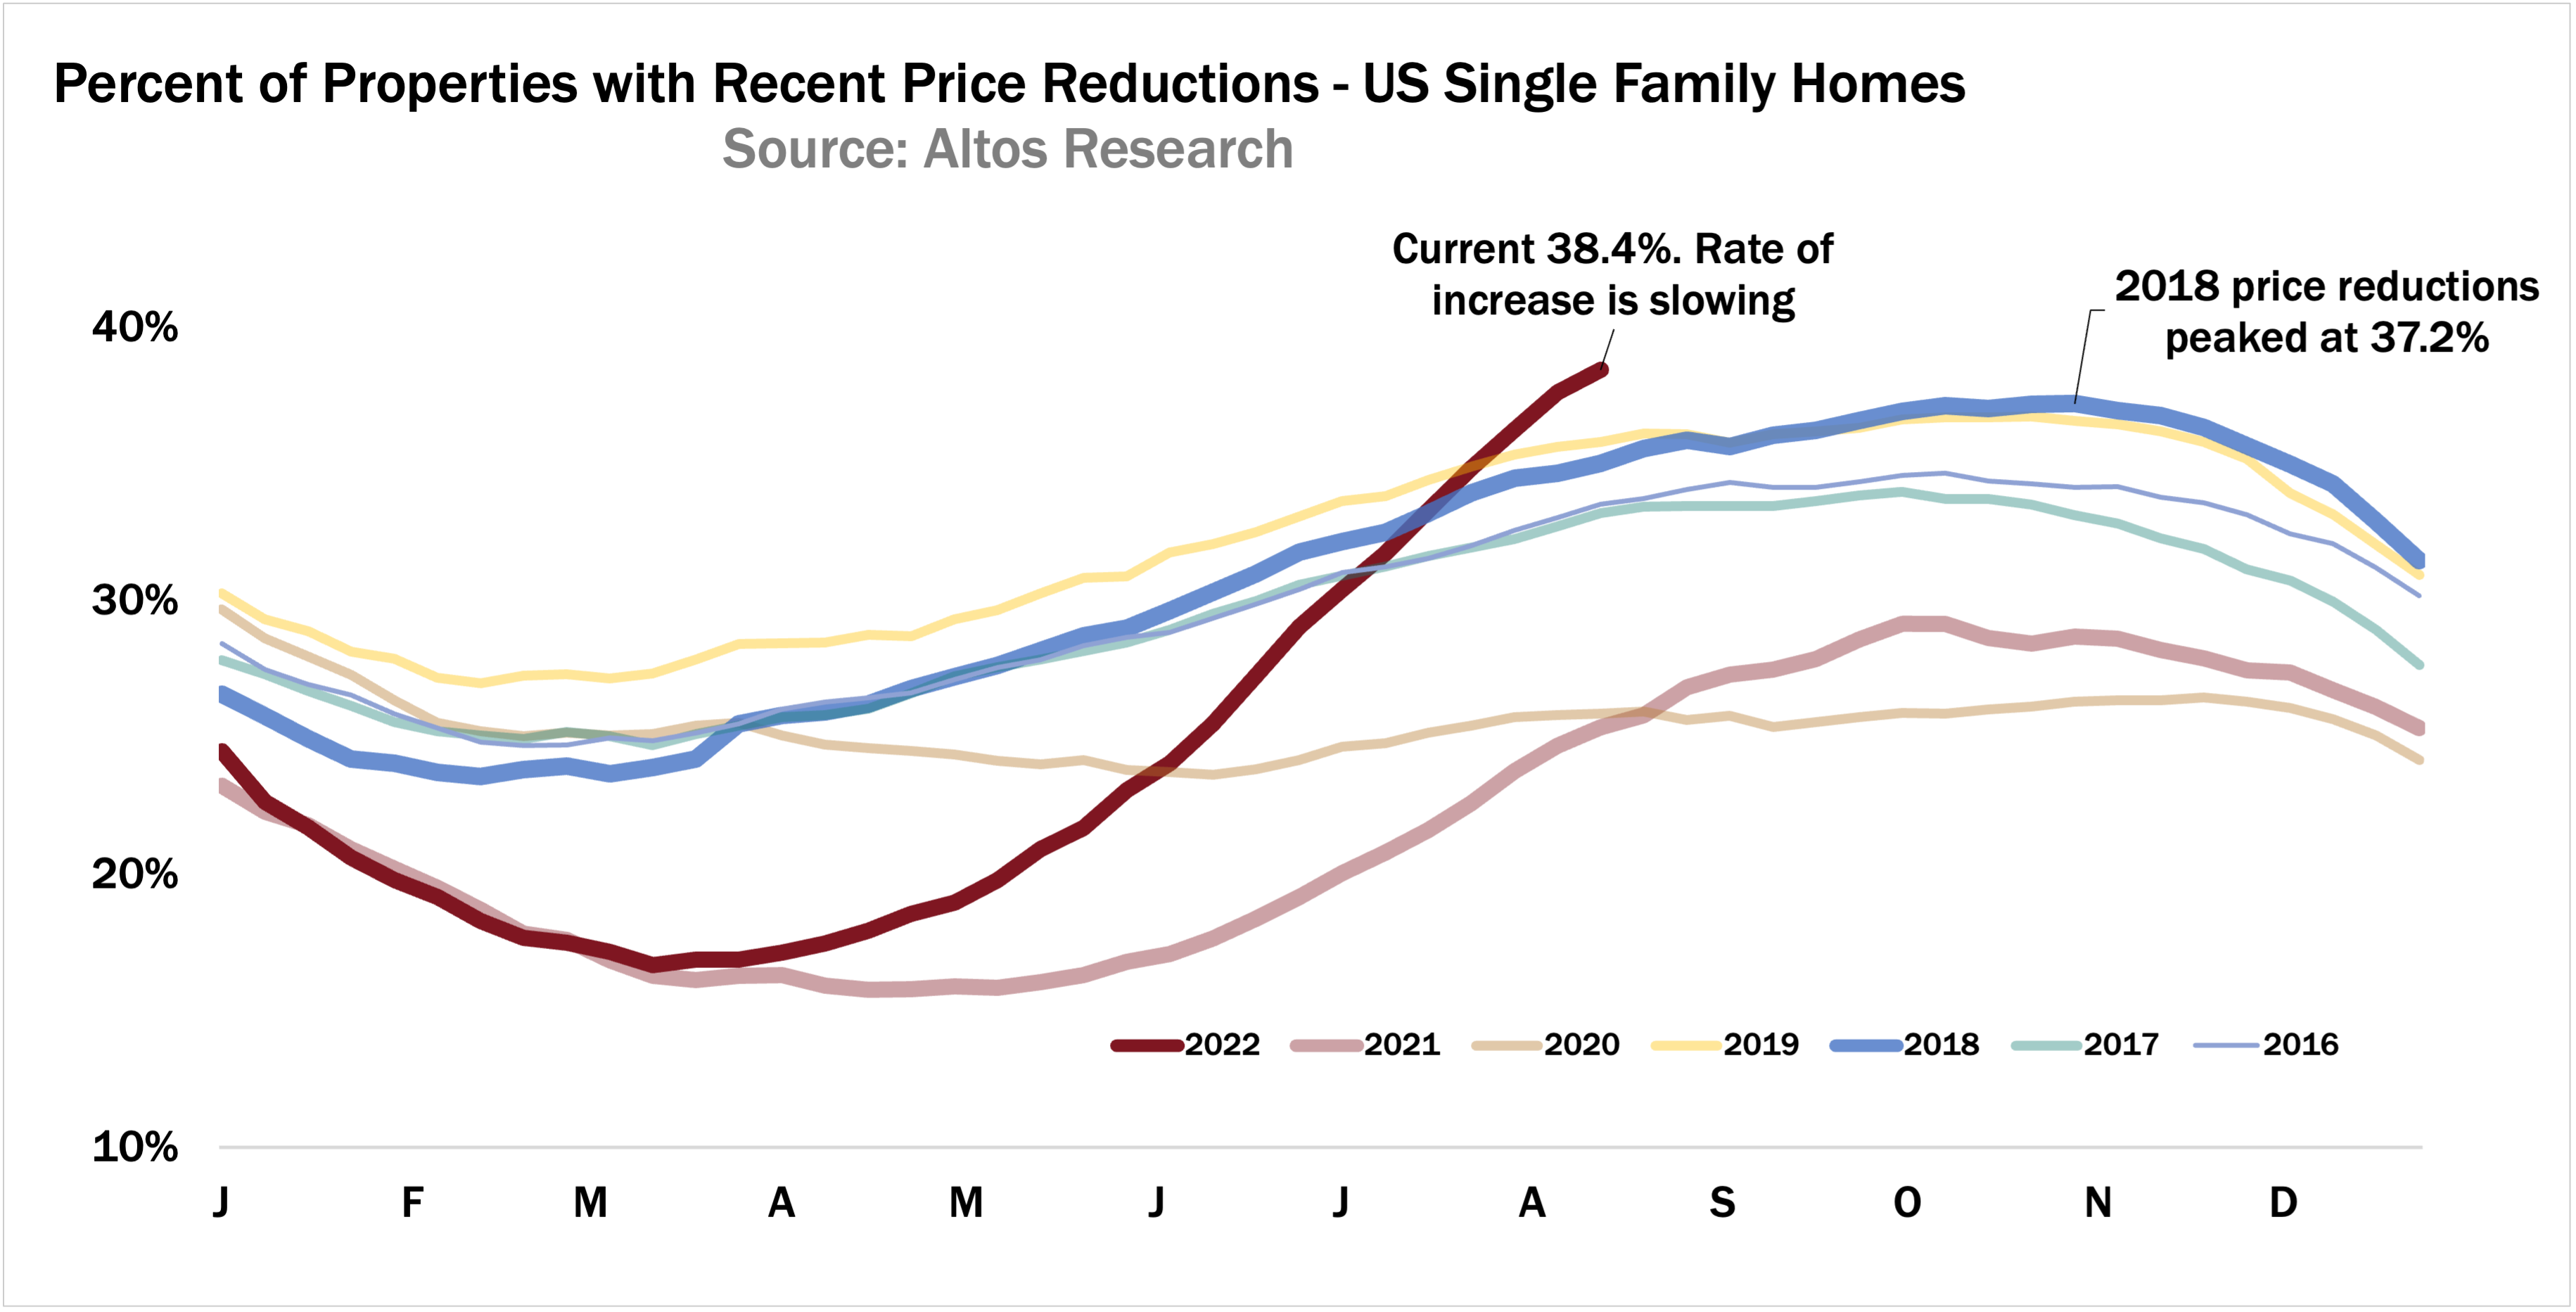
But you can see the curve here in dark red, the pace of new price reductions has turned the corner. You can imagine now how this curve plays out for the rest of the year. 39% next week, 40%. The market will be in the low 40s before it starts receding for the holidays as it resets for the beginning of next year. This is high, it illustrates that buyers backed way off after the frenzy of the first quarter, but it also shows that things aren’t deteriorating. Inventory surprisingly is still tight and buyers are buying the best stuff when priced right.
Price reductions in some of the hottest local markets are pretty crazy though. Boise is up to 60% with price reductions now, Phoenix 58%, Austin, Utah, Florida, Denver markets are 50% or more of the active stock of listings has taken a price cut. Those are bearish conditions for future transaction prices. Sales prices are decreasing in those metros. These are all investor-heavy markets and the investors have pulled back more completely than the owner occupier buyers.
These are all destination markets for California buyers or New York buyers. I wonder if that remote work migration has slowed. I don’t have data on migration so I’m just speculating. Conversely, the central and northeast markets are humming along much more smoothly.
Are these hot markets suddenly halted are they the canaries in the coal mine for the rest of the country? Or are they simply suffering the bullwhip effect we’ve seen in so many other volatile financial markets as a result of the pandemic? Shifting from one extreme to the next?
I tend to think it’s the latter. In which case, this slowdown continues hard but maybe next spring we see much more normal circumstances as the whip is done cracking. As opposed to some spiral downward or contagion across the country. That seems less likely to me.
Immediate Sales
We can see more when we look at our pandemic demand indicator - the immediate sales chart. The dark portion of each bar is the volume of new listings hitting the market each week. The light portion of the bar are those that went into contract essentially immediately after listing. Days or hours.
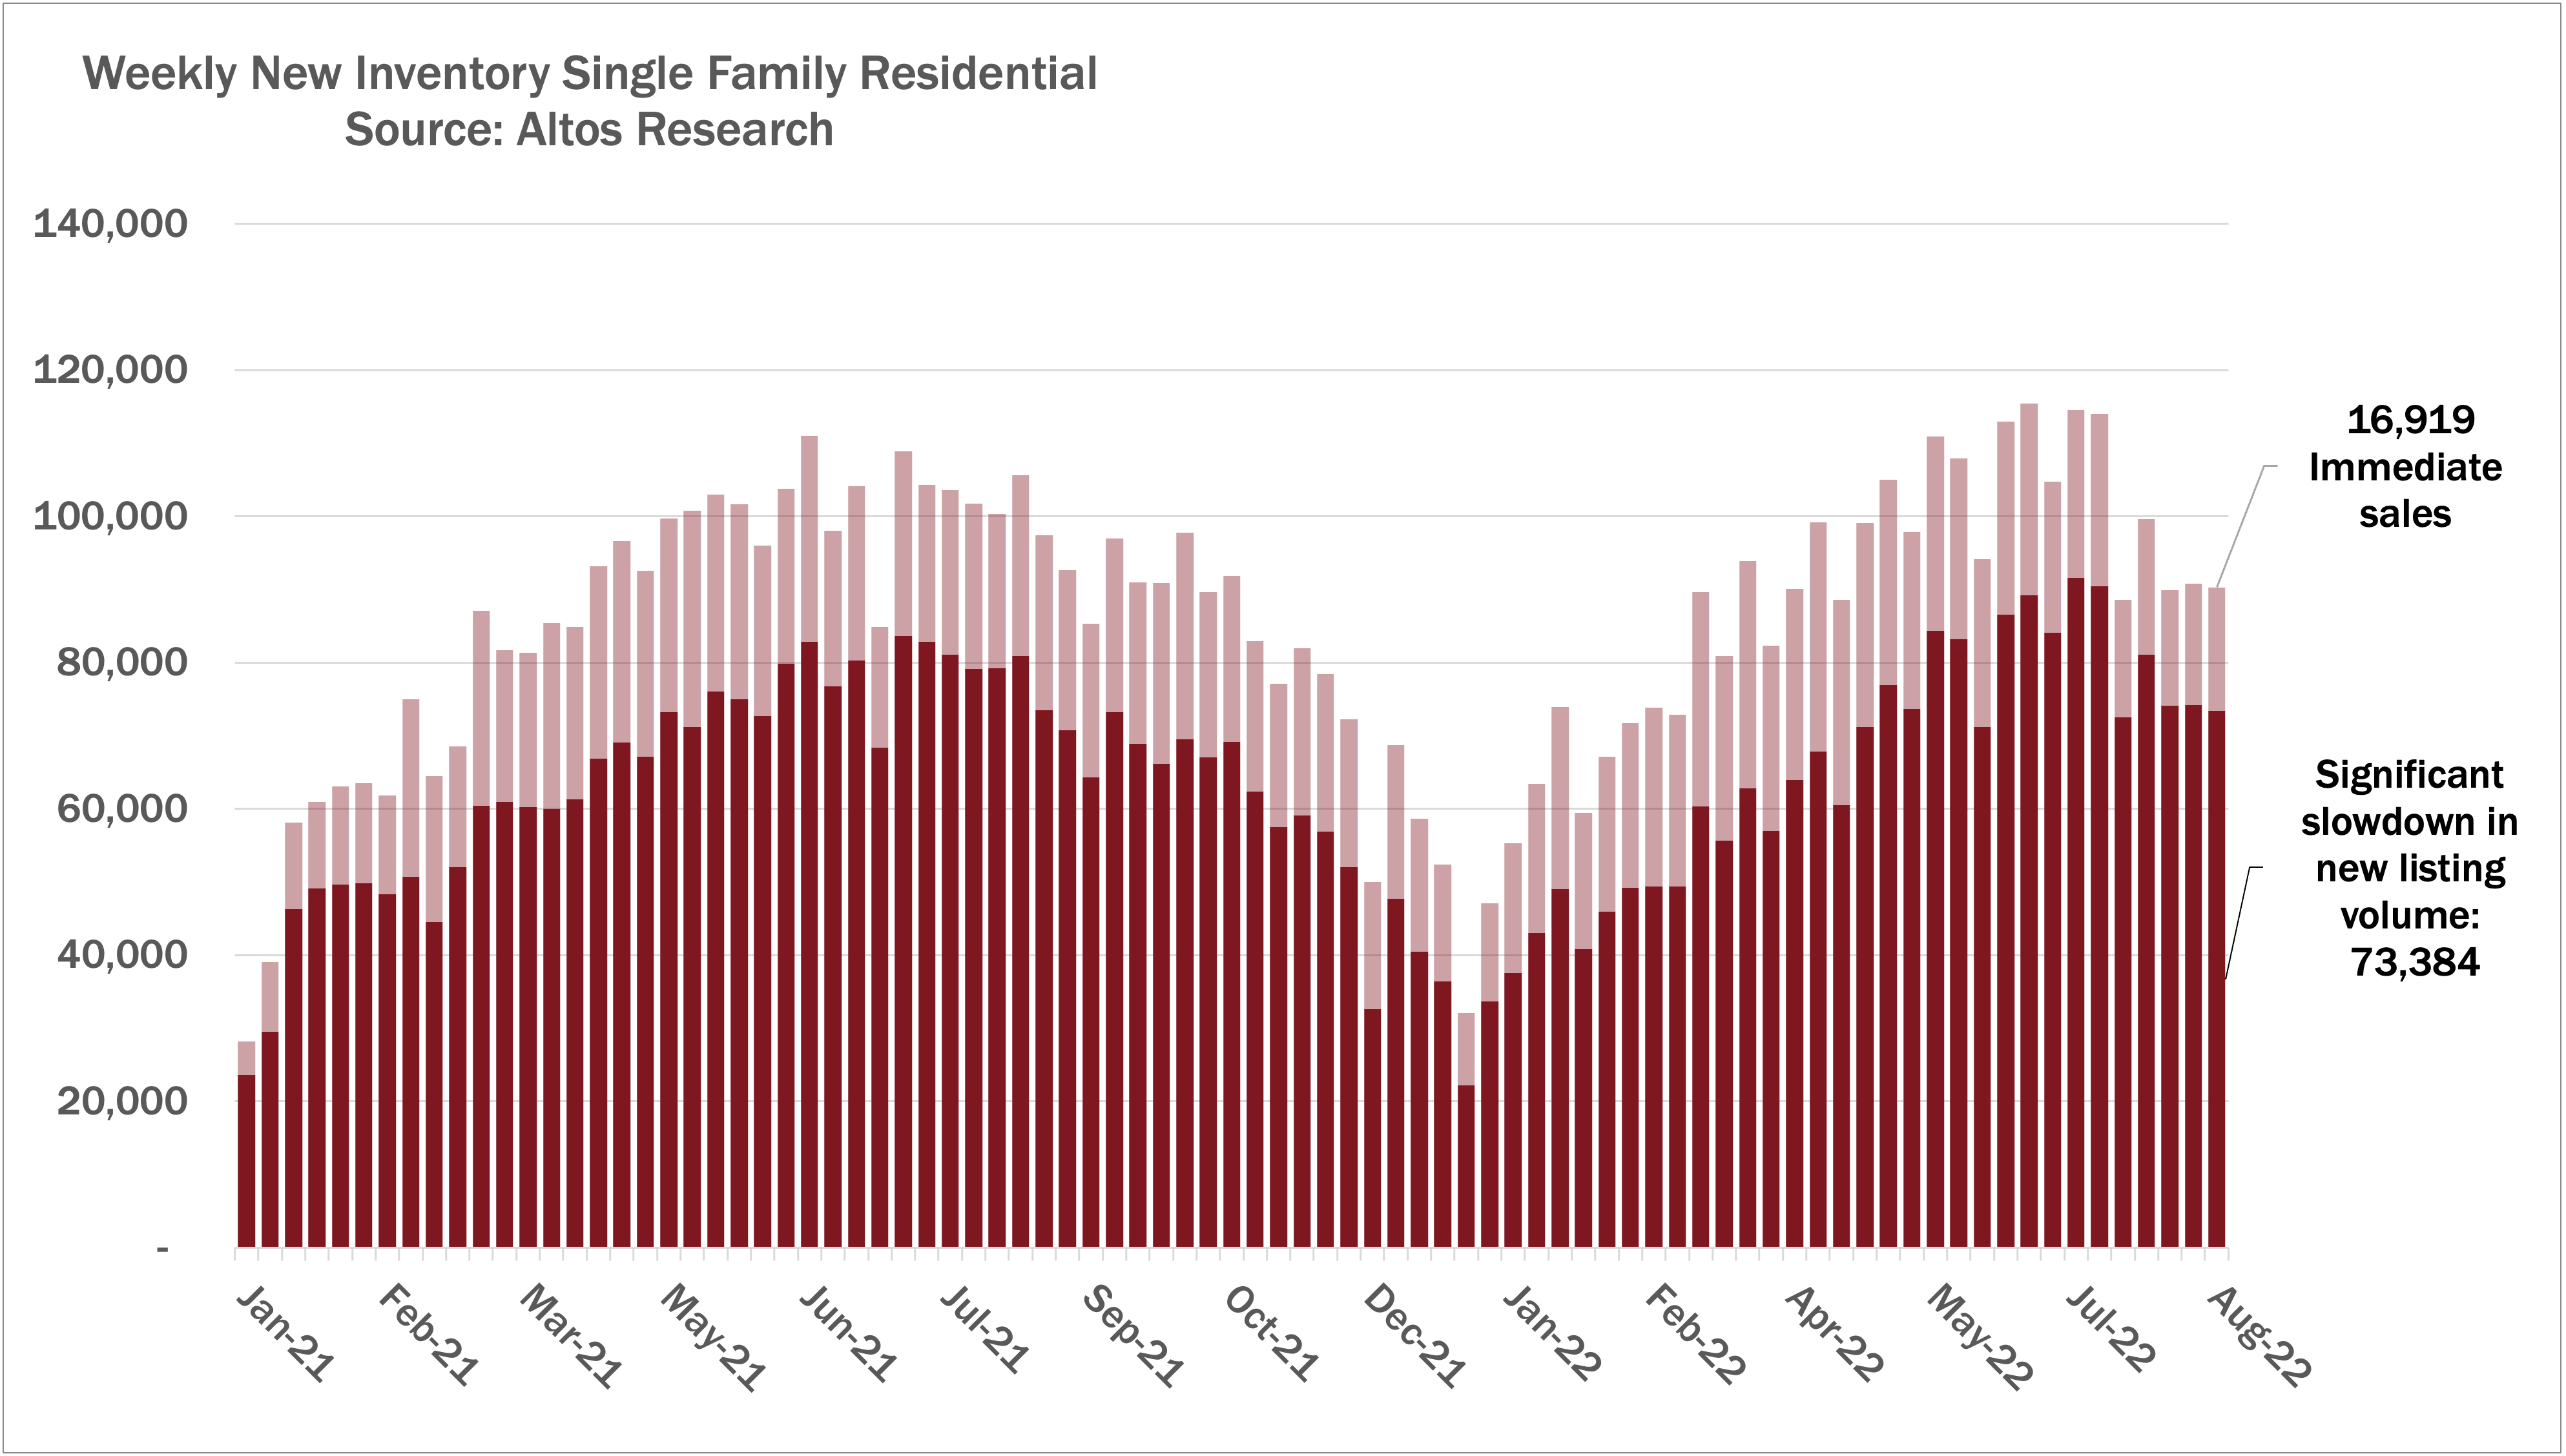
The most striking thing about this chart is the slowdown in new listings after July 4th week. In June we speculated that some of the rapid increase in inventory was sellers rushing to list before things got worse or too late in the year. Now it’s later in the selling season and very few sellers are willing to test the waters. But fewer listings means a constricted market for buyers. It’s a surprising turn. I expected a significantly better opportunity for buyers this summer and it’s a bit better. Less competition, fewer bidding wars. But it’s not great.
My suspicion is that buyers in the market now will be surprised. The summary here is that this chart really illustrates both the demand side subsiding - smaller light colored portions of the bar, and the supply side subsiding - smaller dark portions of each bar each week.
If you have buyers and sellers looking for guidance right now, make sure you get them the data so they can see for themselves what is happening in your local market. Even in those most hard hit markets, we maybe can see the slide slowing. Your buyers and seller need to know that. Go to AltosResearch.com and sign up so you can get the data in your hands and in your clients hands today.
That’s all the data we have time for today. More next week.